Primary data analysis module
Primary data analysis Module is designed to monitor the operating status of installed equipment, the status of equipment in near real time and to identify errors and failures in its operation. The module includes a side menu section Primary data analysis and subsections Real Time Monitoring, Detector Analysis and Status Diagram.
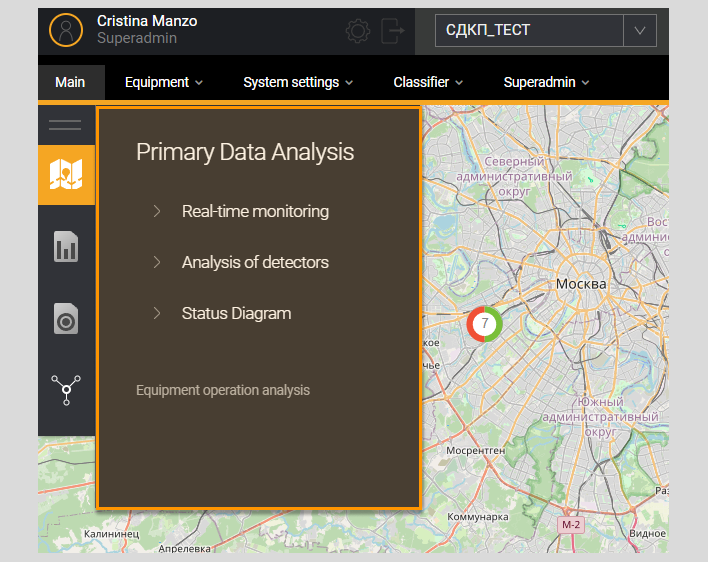 //НА ИЗОБРАЖЕНИИ НЕСООТВЕТСТВИЕ ИКОНОК БОКОВОГО МЕНЮ
и сбоев в его работе и мониторинга статуса оборудования в режиме реального времени. Модуль включает в себя раздел бокового меню Первичный анализ данных и подразделы Мониторинг в реальном времени, Анализ детекторов и Диаграмма статуса.
Real-time monitoring
Side menu subsection Real Time Monitoring is designed to monitor the status of detectors in real time. The tab is accessed from the side navigation menu by selecting a subsection of the side menu Real Time Monitoring in section Primary data analysis.
On the right in the drop-down list Detectors, you can select the required detectors to sort the list. By default, all detectors in the project are selected.
At the top of the Real Time Monitoring page there is: information field Last update time (left) and field Update Interval (on right). When you select an update interval, a time counter from the last update appears in the last update field.
Drop-down list Update Interval to select the period for automatically updating the detector operating status data, it is a standard field with a drop-down list. When you select a value from the drop-down list, the real-time monitoring information will be automatically updated once during the selected period.
The field is set to No by default, i.e. automatic updating is not performed. The following periods are available for selection in the list:
- No
- 5 second
- 10 Seconds
- 30 seconds
- 1 minute
- 2 minutes
- 5 minutes
There is a page refresh button near the field Update Interval.
In the center of the page there is a list of detectors (all detectors included in the selected project in the System are displayed).
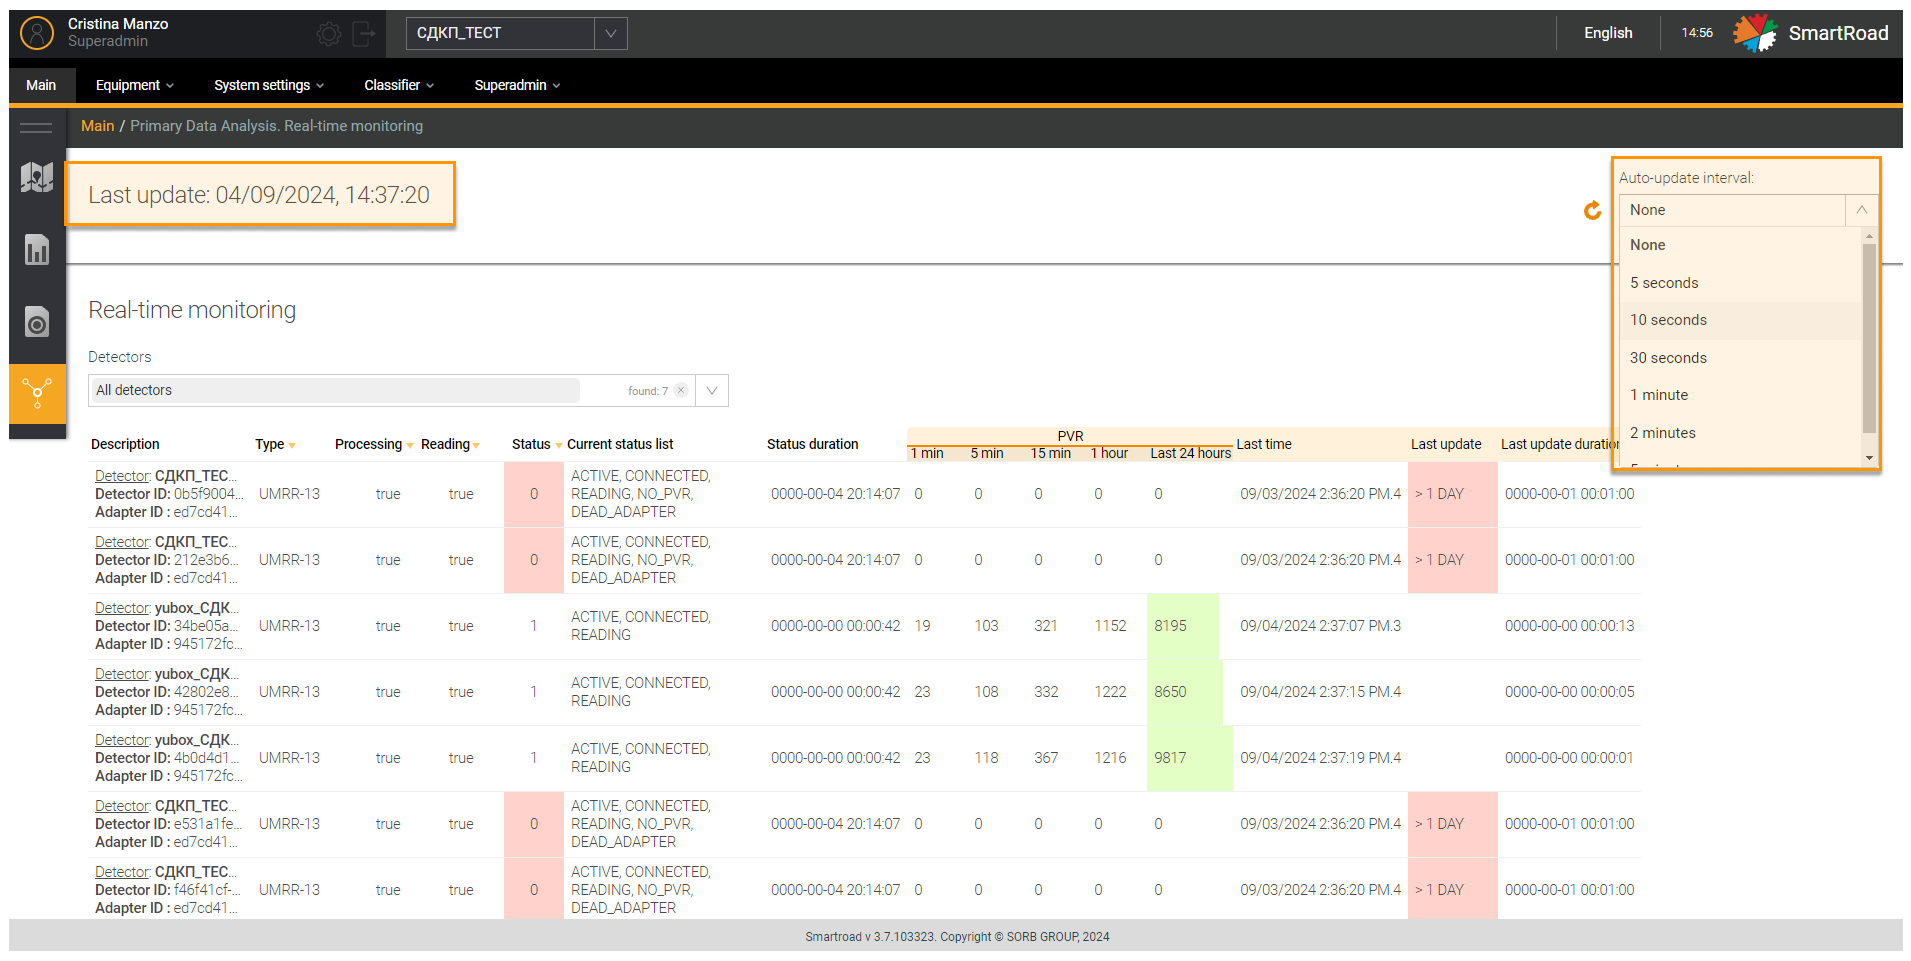
You can find the Description of real-time monitoring list fields in the table
| Parameter | Description |
|---|---|
| Description | The field displays: - detector name - Detector ID - Adapter ID |
| Type | Detector type |
| Processing | Status of data processing from the detector adapter. Possible status: - true – data from DT is being processed - false – data from DT is not processed |
| Reading | Status of reading data from the detector by the adapter. Possible values: - true – data from DT is read - false – data from DT is not read |
| Status | Description of DT statuses and conditions for their determination in the System. These detector status can be: 0 – red 1 – green 2 – yellow 3 - gray (not displayed in this module) 4- blue |
| Current status list | The list of detector statuses at the time of updating the information on the page corresponds to the status of detectors on the interactive map. |
| Duration of status | Time since the last change in the detector status |
| PVR | Section where PVR data is displayed |
| 1 min | Number of PVRs in the last minute since the information on the page was updated |
| 5 min | Number of PVRs in the last 5 minutes since the information on the page was updated |
| 15 min | Number of PVRs for the last 15 minutes since the information on the page was updated |
| 1 time | Number of PVRs in the last hour since the information on the page was updated |
| Last 24 hours | Number of PVRs in the last 24 hours since the information on the page was updated |
| Last time | Time of last data received from the detector (maximum displayed time - Last time) |
| Updated | The period from the last time data was received from the detector |
| Duration of last update | Time since last PVR received |
The user can view additional information for each detector by clicking on the detector line.
The additional information page on DT includes two sections:
- Data update – the section displays information about the latest receipt of data from DT.
- PVR – this section displays information about the latest PVR received from the DT.
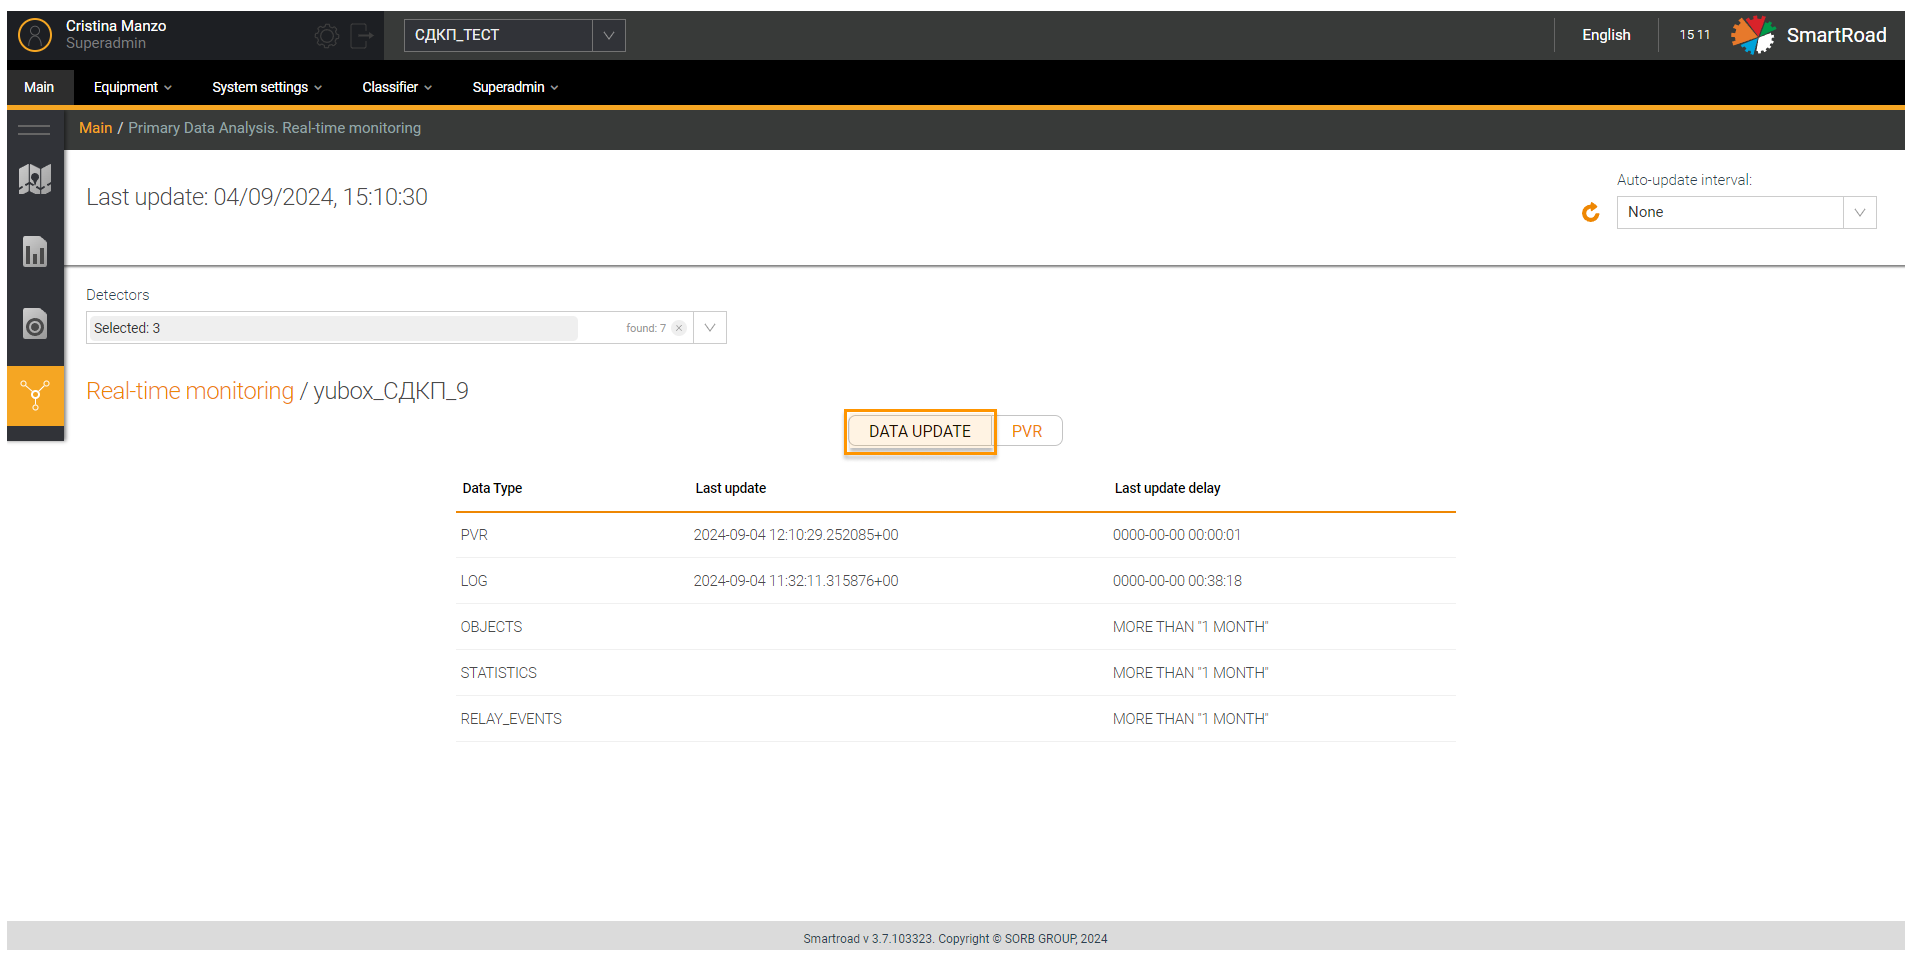
Next table includes the Description of the Data Update section.
| Parameter | Description |
|---|---|
| Data type | Type of data received from DT: - OBJECTS (objects) - PVR (vehicle recording) - LOG - STATISTIC (statistics) - RELAY_EVENTS (triggers) |
| Updated | Time of last receipt of data from DT |
| Latest update delay | Time period since the last receipt of data from the DT |
In the figure below the PVR section in Real-time monitoring page
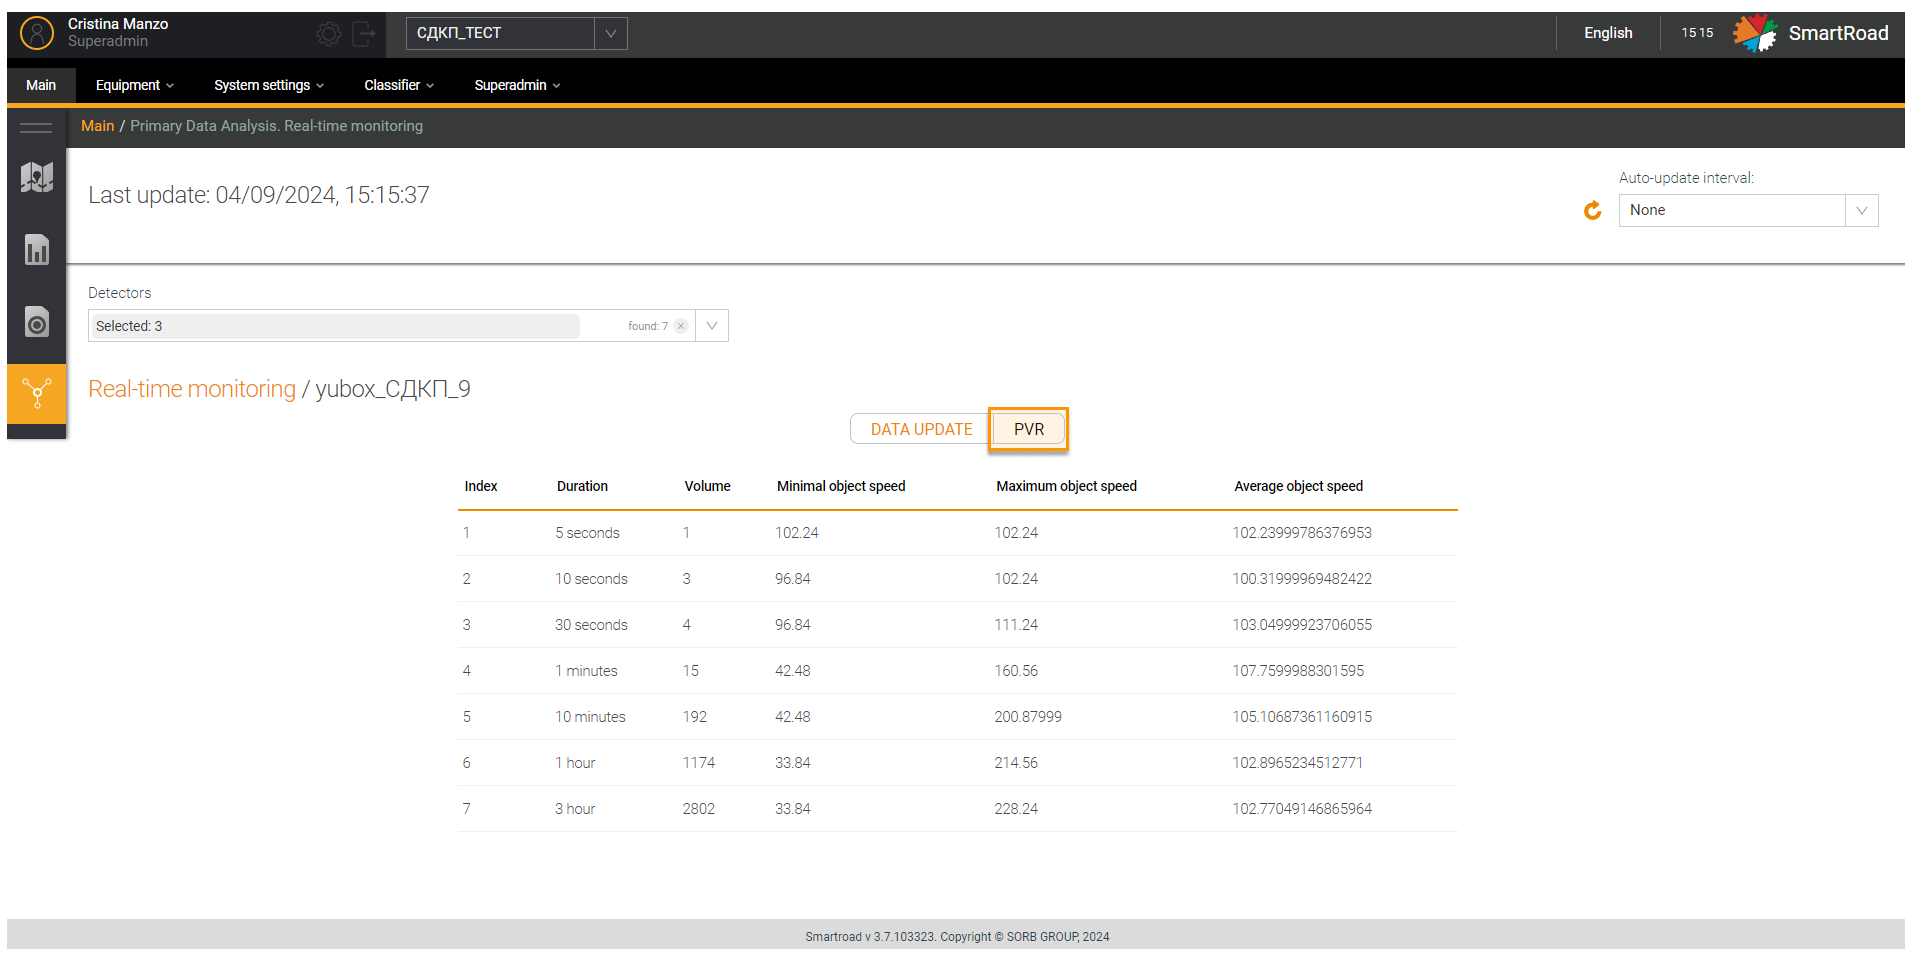
Besides the parameters Description in PVR section
| Parameter | Description |
|---|---|
| Index | PVR serial number |
| Duration | Time period for which the data was obtained |
| Quantity | Number of PVRs received during the time period |
| Minimum object speed | Minimum object speed |
| Maximum object speed | Maximum object speed |
| Average object speed | Average object speed |
Detector analysis
The side menu subsection Detector Analysis is designed to generate reports on equipment operation for further analysis. The tab is accessed from this menu by selecting a subsection Detector Analysis in section Primary data analysis.
At the top of the page there is a data selection filter in which parameters for generating a report are entered into the appropriate fields.
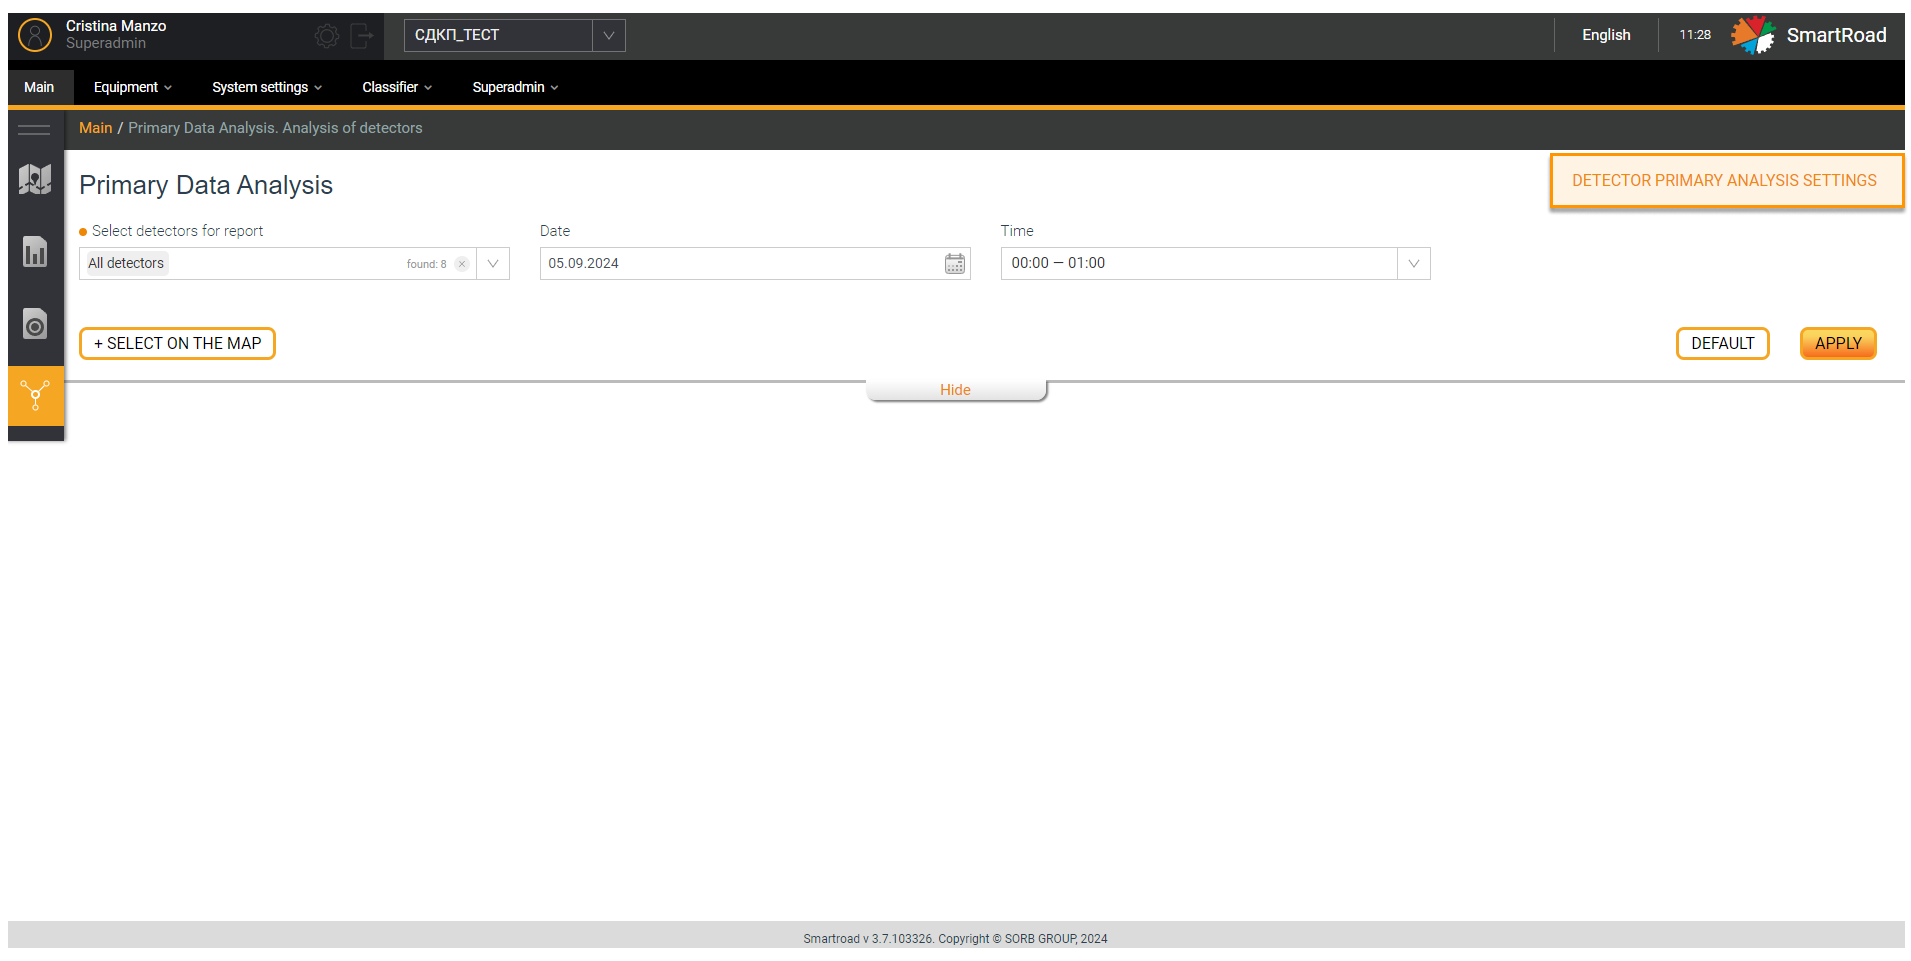
The following Report filter options are available
| Parameter | Description |
|---|---|
| Selecting detectors for report | In the drop-down list, detectors are selected, based on the data from which the report will be generated. The field is a drop-down list with the ability to select several detectors. The selection of detectors is carried out by checking the checkbox in the list. By default, all detectors are selected. |
| Date | In the calendar, select the date for generating the report in the format “DD.MM.YYYY”. |
| Time | In the drop-down list, select the hourly interval for generating the report in the from - to format. |
| Select on map | Button for selecting detectors on the map. By clicking on the button, the user is shown a pop-up window with an interactive map for selecting detectors. The selection is made in the same way as selecting detectors on the main map |
| Apply | Button for applying report generation parameters. By clicking on this button, the system generates a report and displays it to the user |
| Reset | Filter parameters reset button. When user clicks on it, all filter entered parameters are set to default values |
| Hide/Show | The button allows you to collapse and expand the filter section |
| Setting up primary data | Link to go to the Setting up primary data analysis tab. A description of the tab is presented in the next section Setting up primary analysis. |
Once completing the report generation, the System displays to the user the report in two ways (the corresponding tabs are located below the filter):
- As a Table;
- Diagram
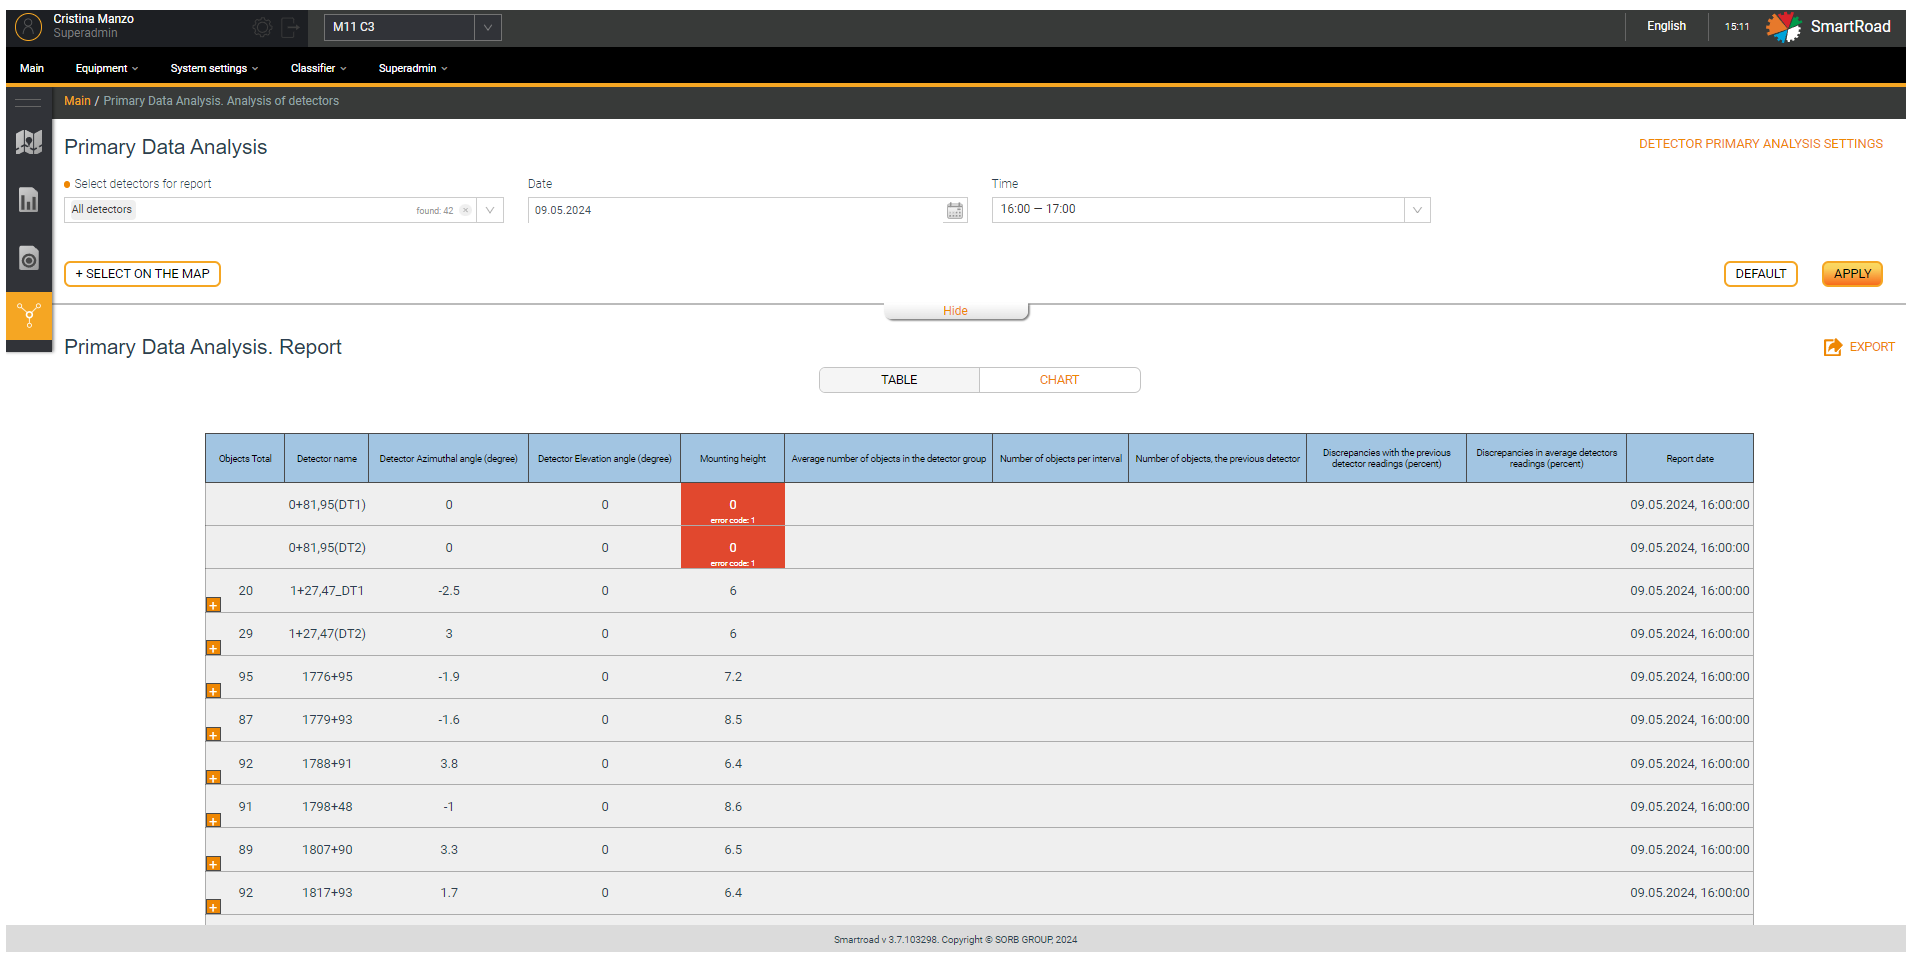
Below you can find the Parameters Description of the table in the Primary data analysis report
| Parameter | Description |
|---|---|
| Total objects | Number of objects registered for the selected period |
| Detector name | The detector name |
| Detector rotation angle (degrees) | Detector rotation angle set during installation |
| Detector tilt angle (degrees) | Detector tilt angle set during installation |
| Installation height (m) | Detector mounting height |
| Average number of objects in a group of detectors | Average number of objects in a detector group ( the detector is included in the DT group) |
| Number of objects per interval | Number of objects per time interval |
| Number of objects previous detector | Number of objects registered by the previous detector in the group (the detector is included in the DT group) |
| Differences with the readings of the previous detector (%) | Percentage of discrepancies between the readings of one detector and the readings of the previous detector for the selected period |
| Differences in average detector readings (%) | Percentage of discrepancies between detector readings for the selected period and average DT readings |
| Report date | Report generation date |
Regarding the Tabular part of the report, on each line there is a button for detailed information (in the form of a plus sign). When you press the button, detailed information on the selected detector is opened.
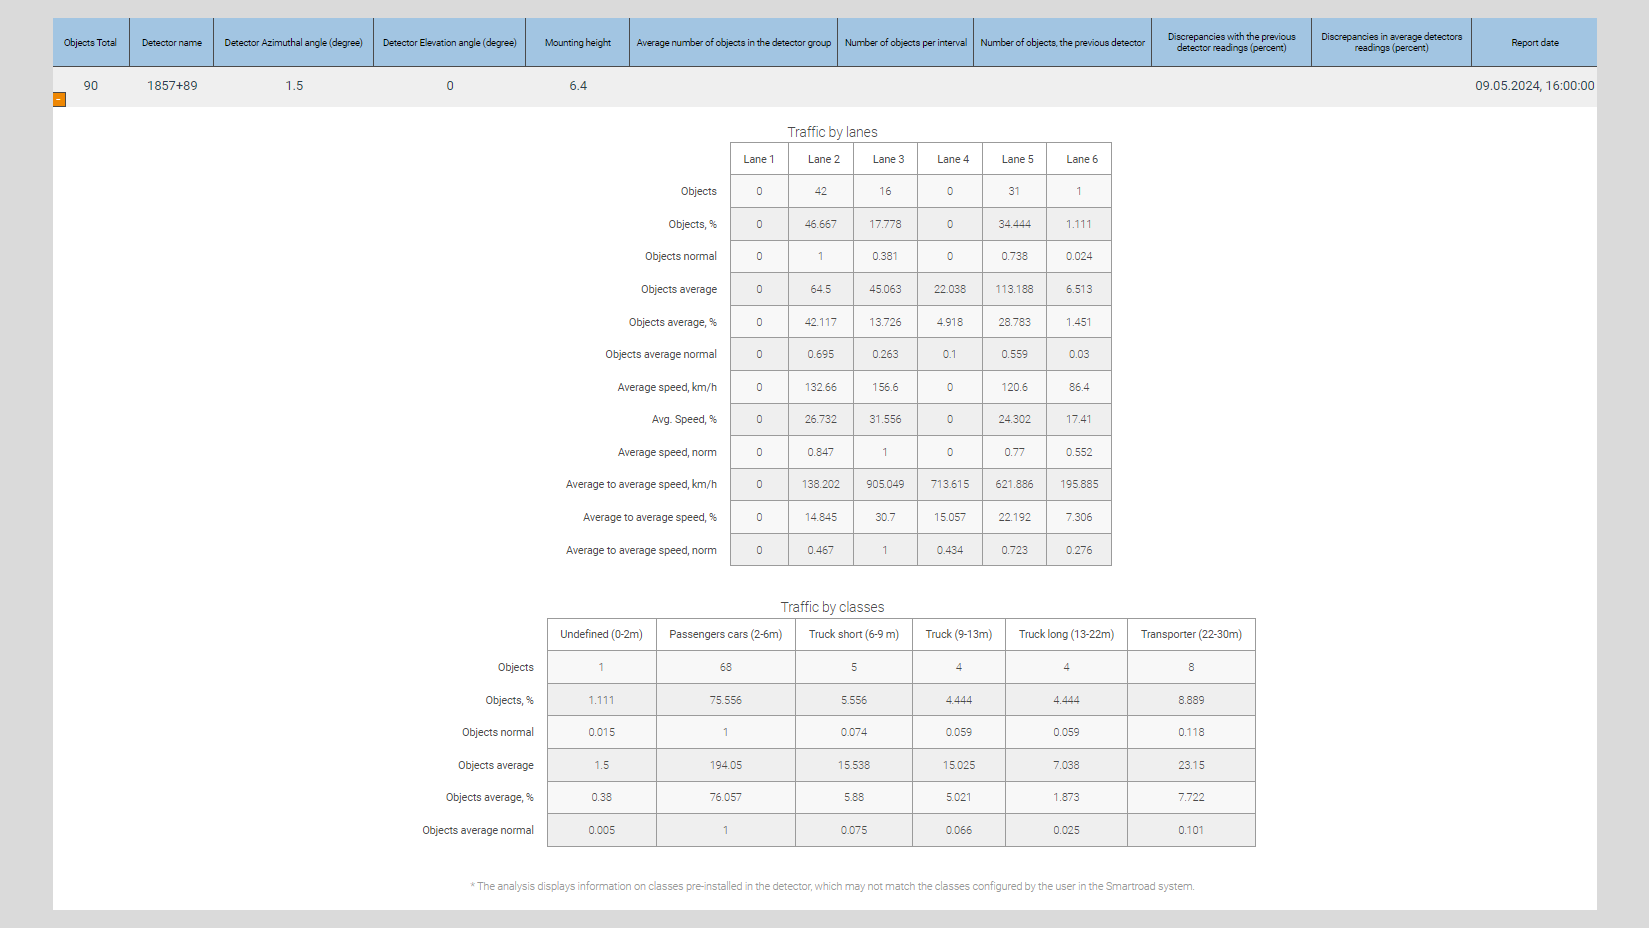
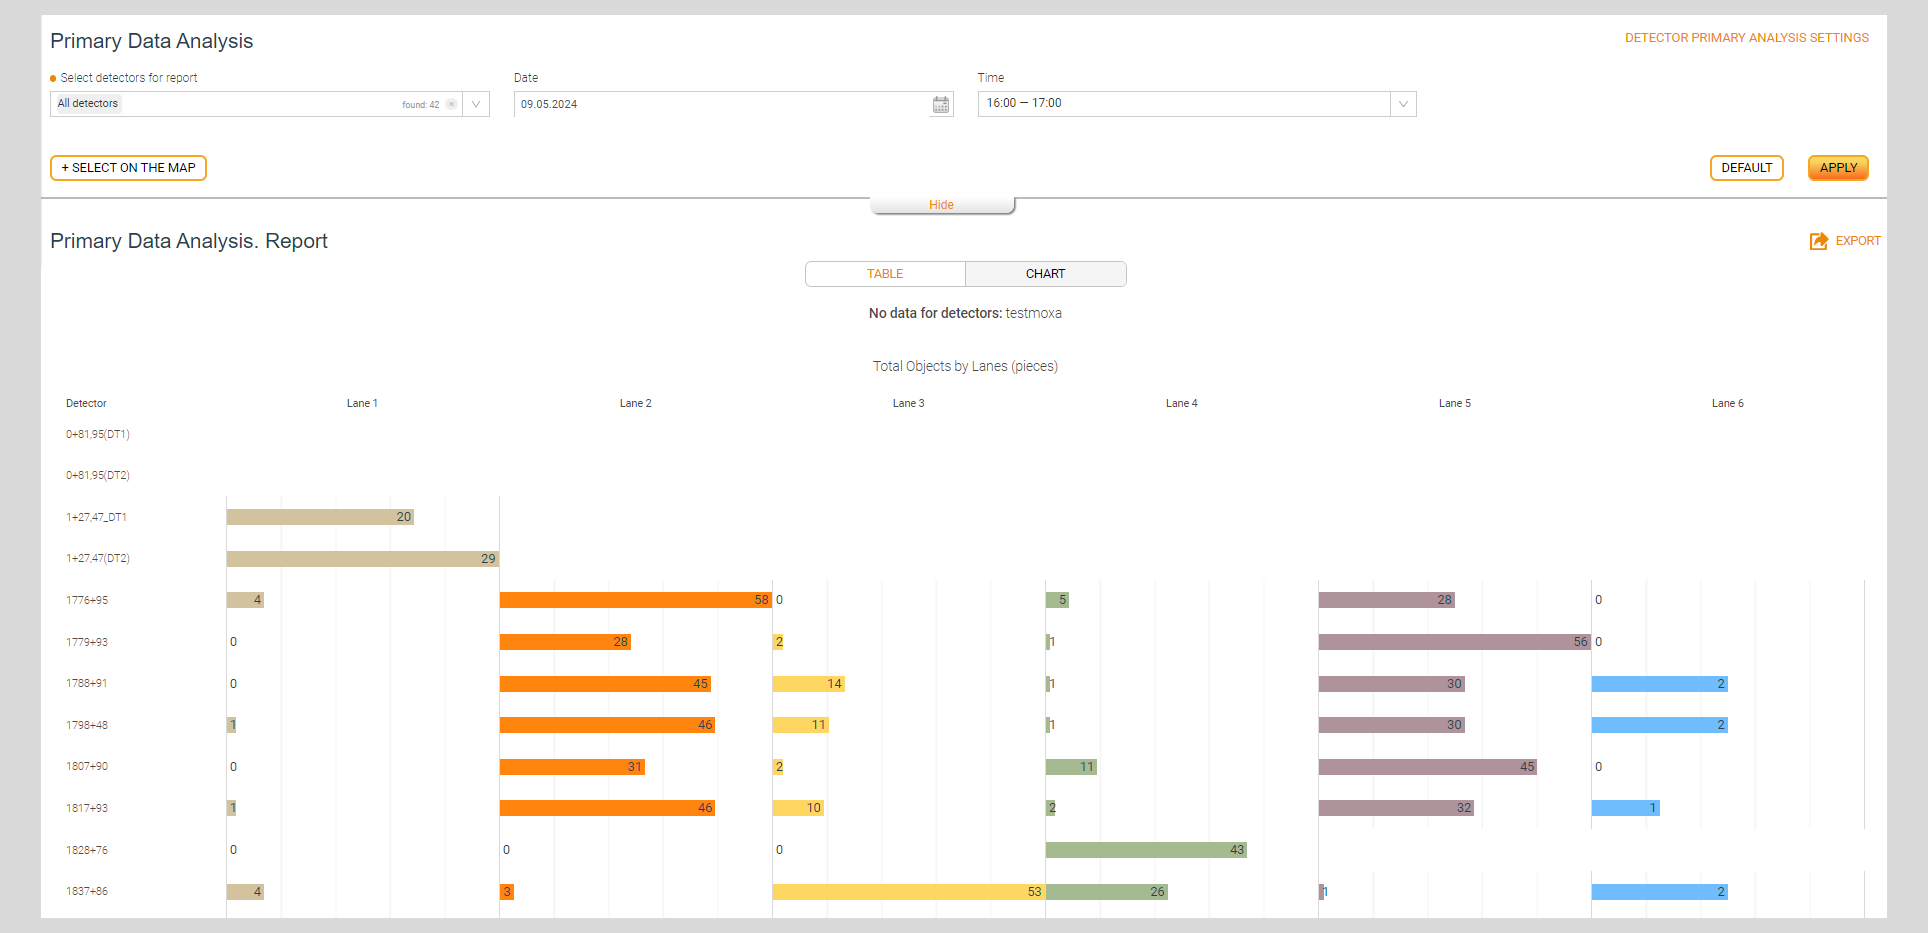
In addition, you will have the Equipment operation report diagram
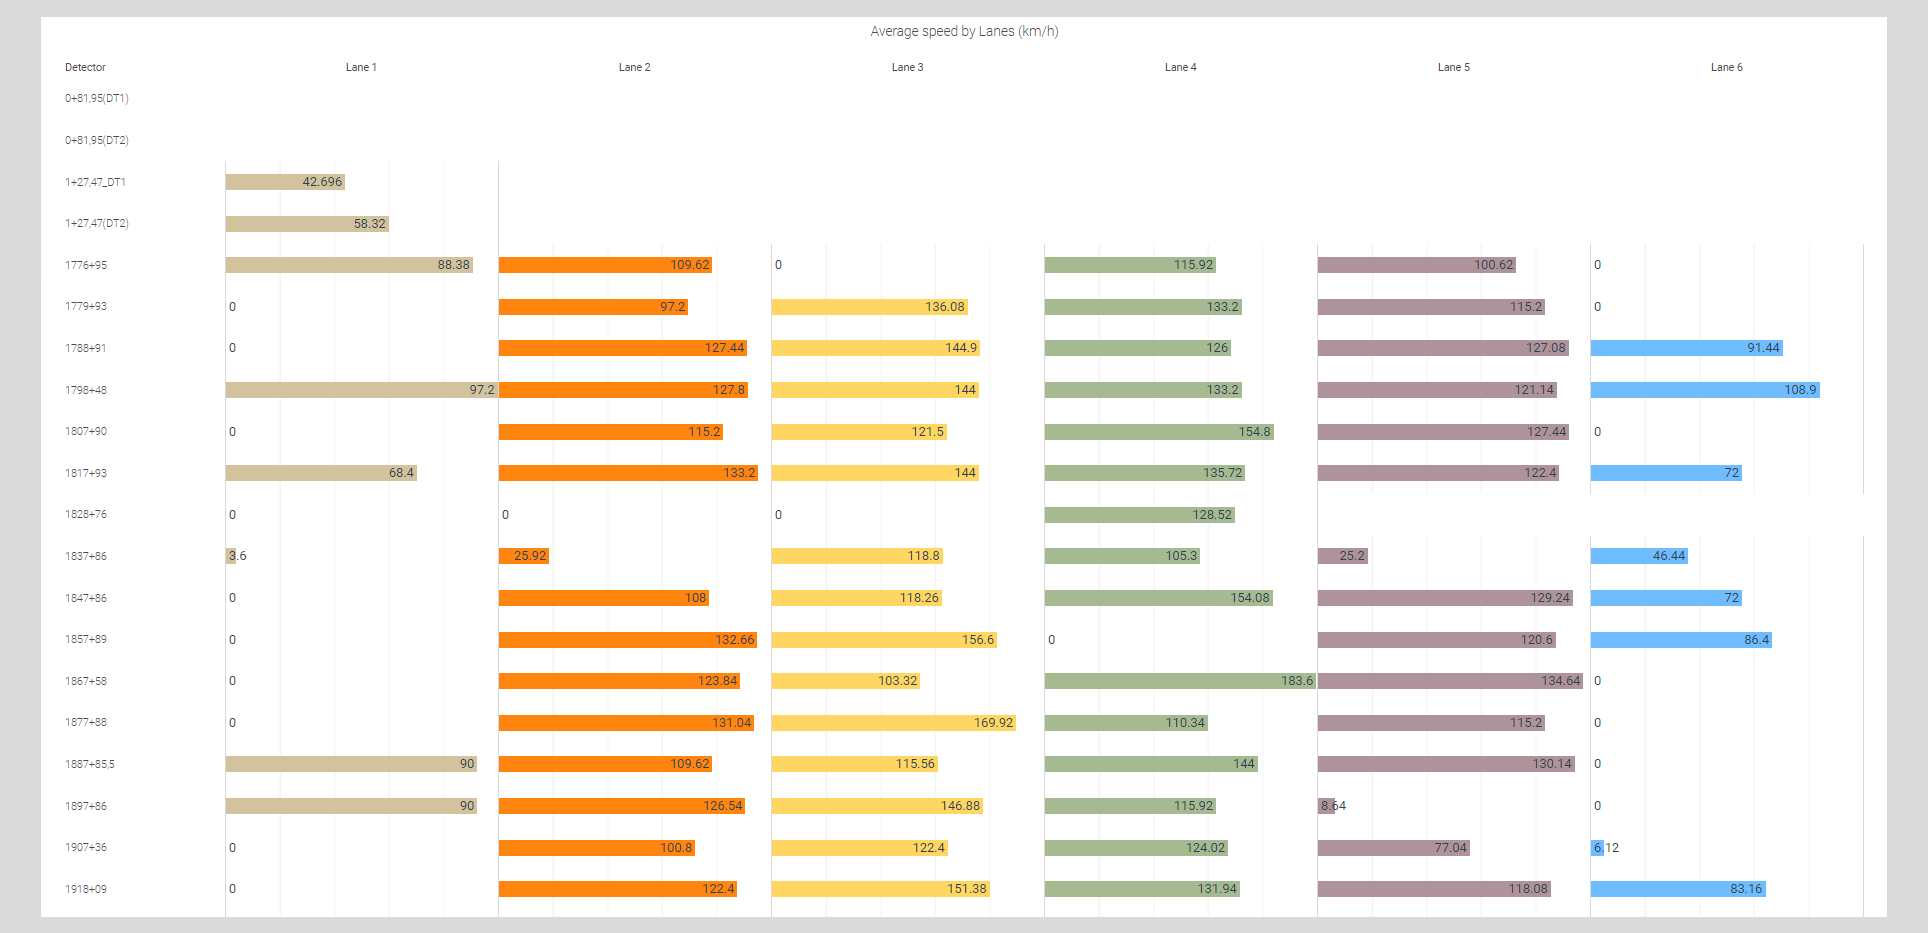
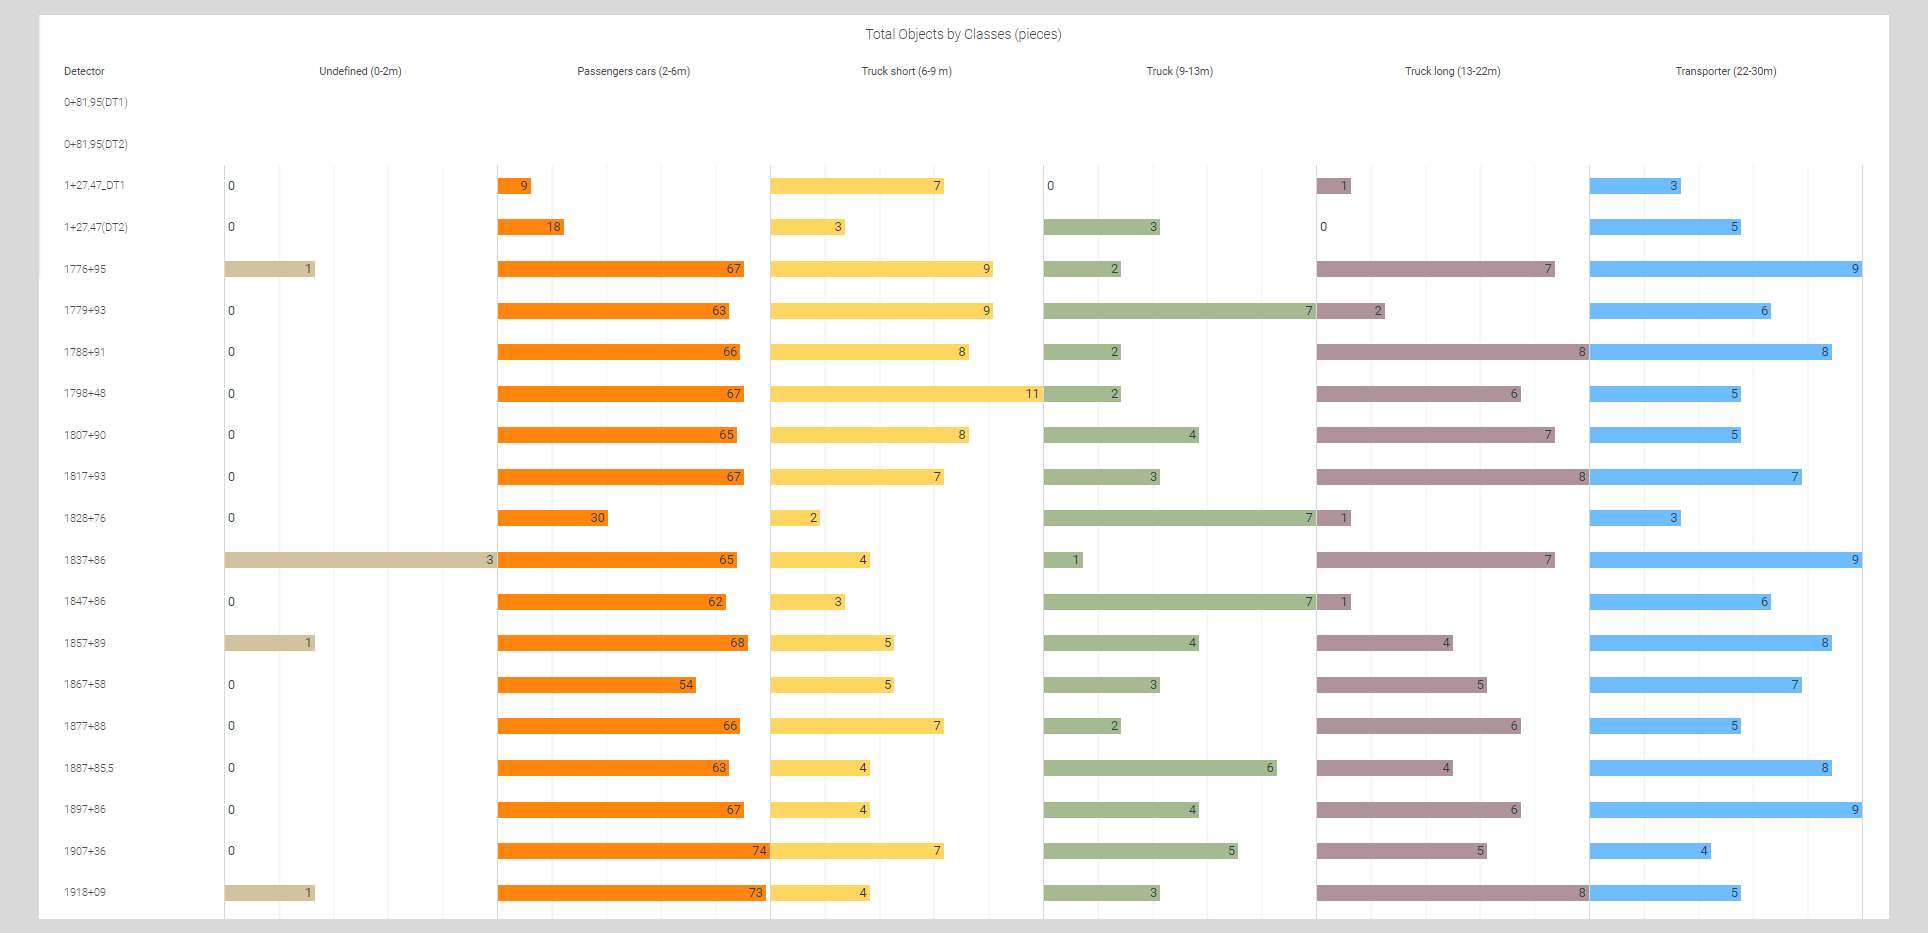
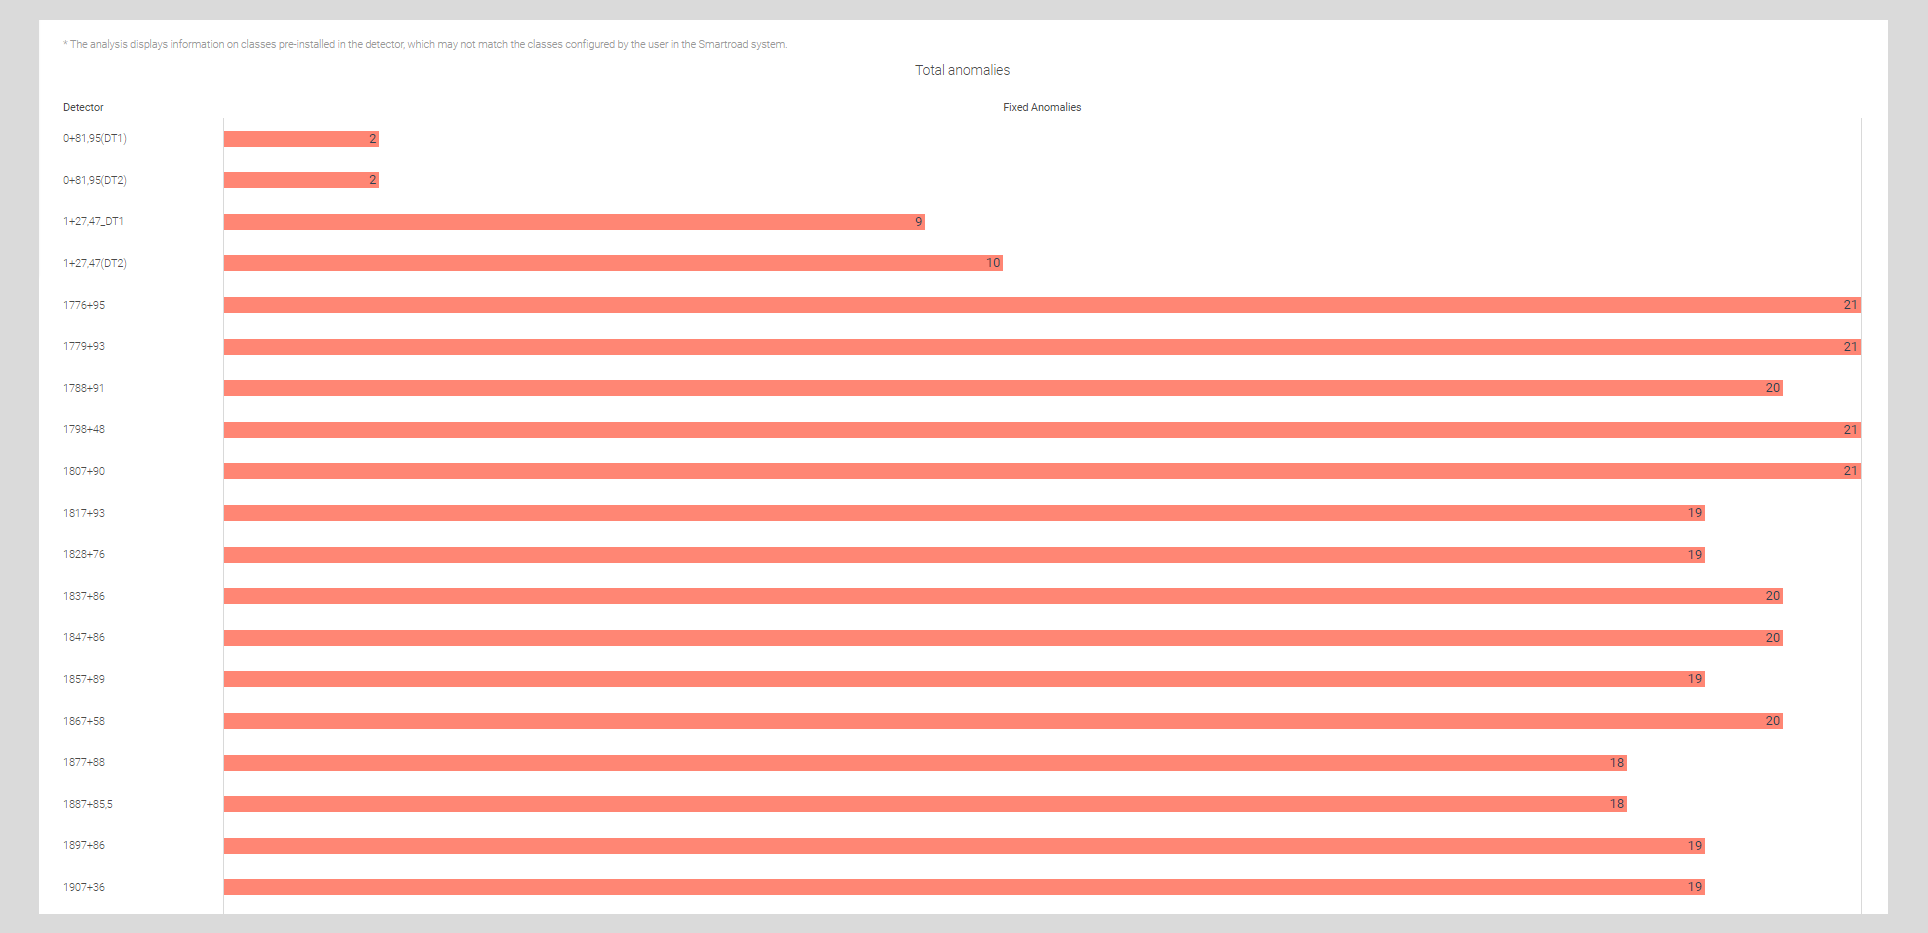
The diagram of the equipment operation report shows in graphical form:
- Number of objects by lane;
- Average speed by lane;
- Number of objects by classes;
- Identified anomalies in the operation of the detector.
Each generated report with detailed information can be exported to an external file in Excel format. You can click on the button Export that is located at the top right of the table to export the report.
Setting up primary data analysis
This Tab is designed to set analytical parameters for generating reports on equipment operation. Go to the tab by clicking on the button Setting up primary data analysis, it is located in the upper right part of the primary data analysis page.
The following parameters are set on this section:
- Analytical sampling period – period for analyzing detector operating data;
- Analytical sampling interval – time interval of data breakdown for analyzing detector operating data (day, hour);
- Norm of discrepancies in detector readings – percentage threshold of discrepancies in detector readings, values above which the System recognizes as unacceptable.
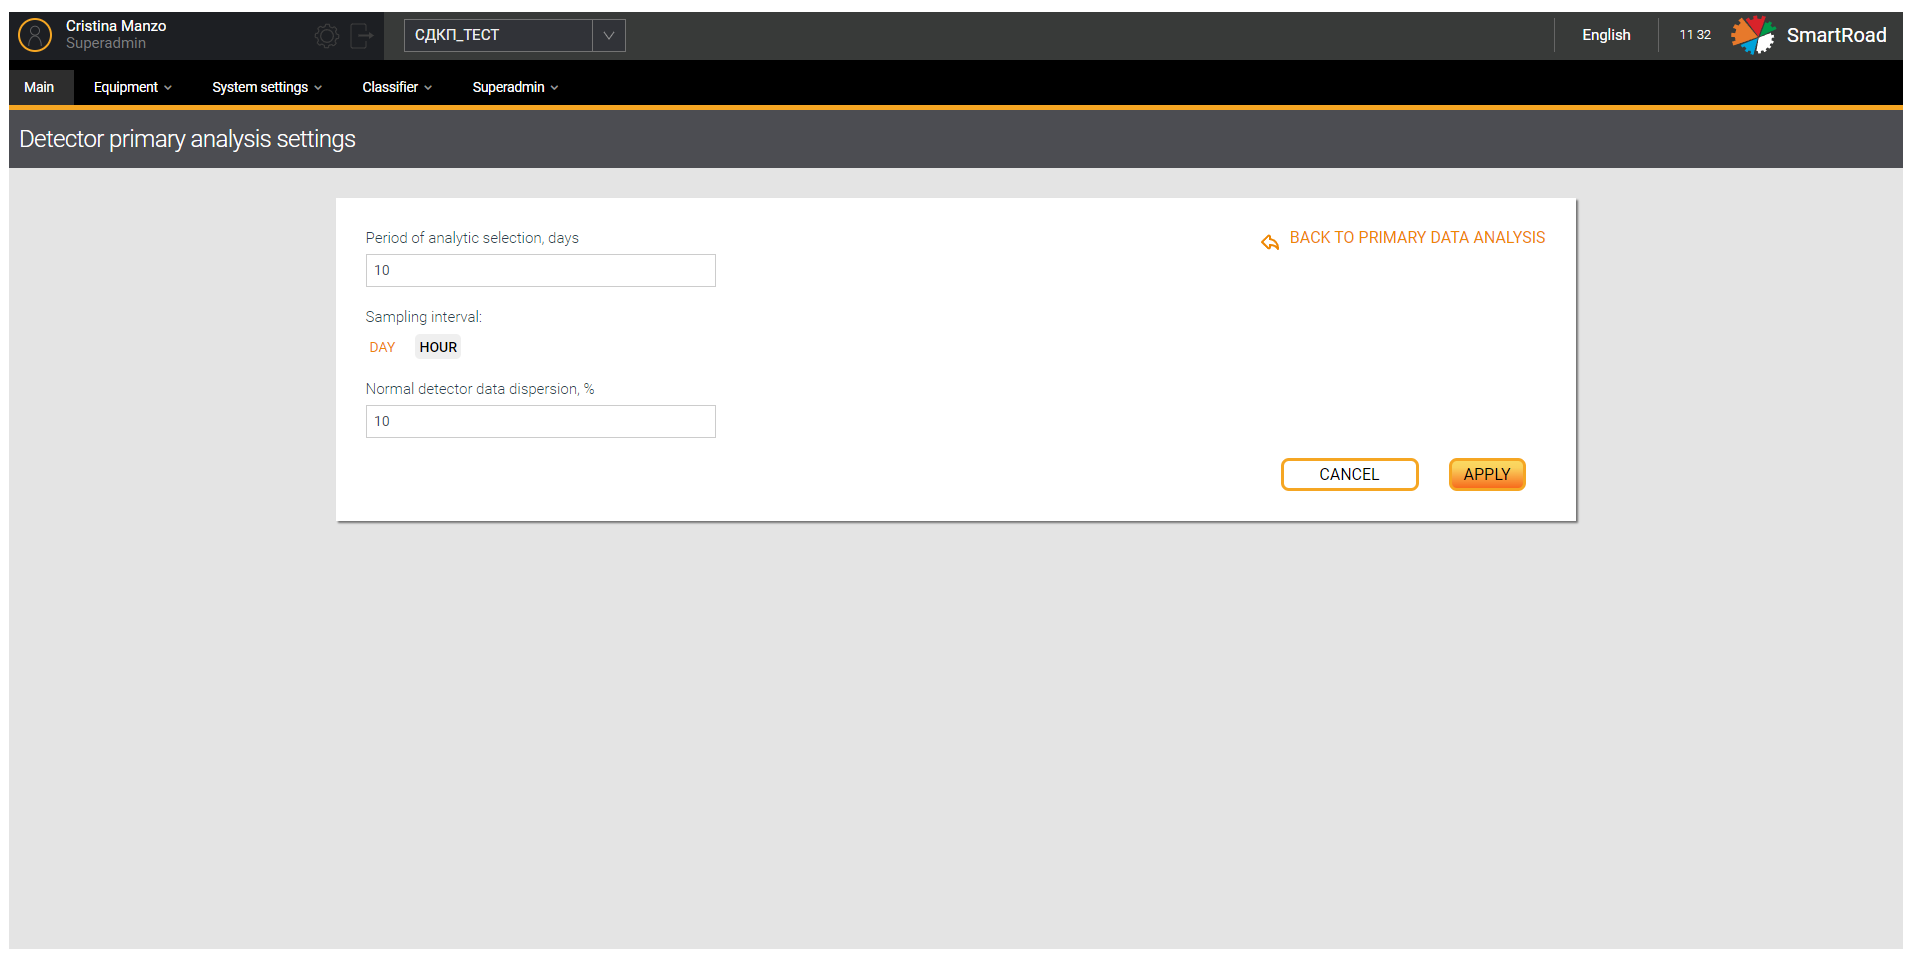
Click on the Back to primary data analysis button to exit the Primary data analysis settings subsection.
Status diagram
The tab is accessed from the side navigation menu when selecting a subsection Status Chart in section Primary data analysis. Besides, the Subsection Status Chart is designed to monitor equipment operating time.
At the top of the page there is a data selection filter in which parameters for generating a chart are entered into the appropriate fields.
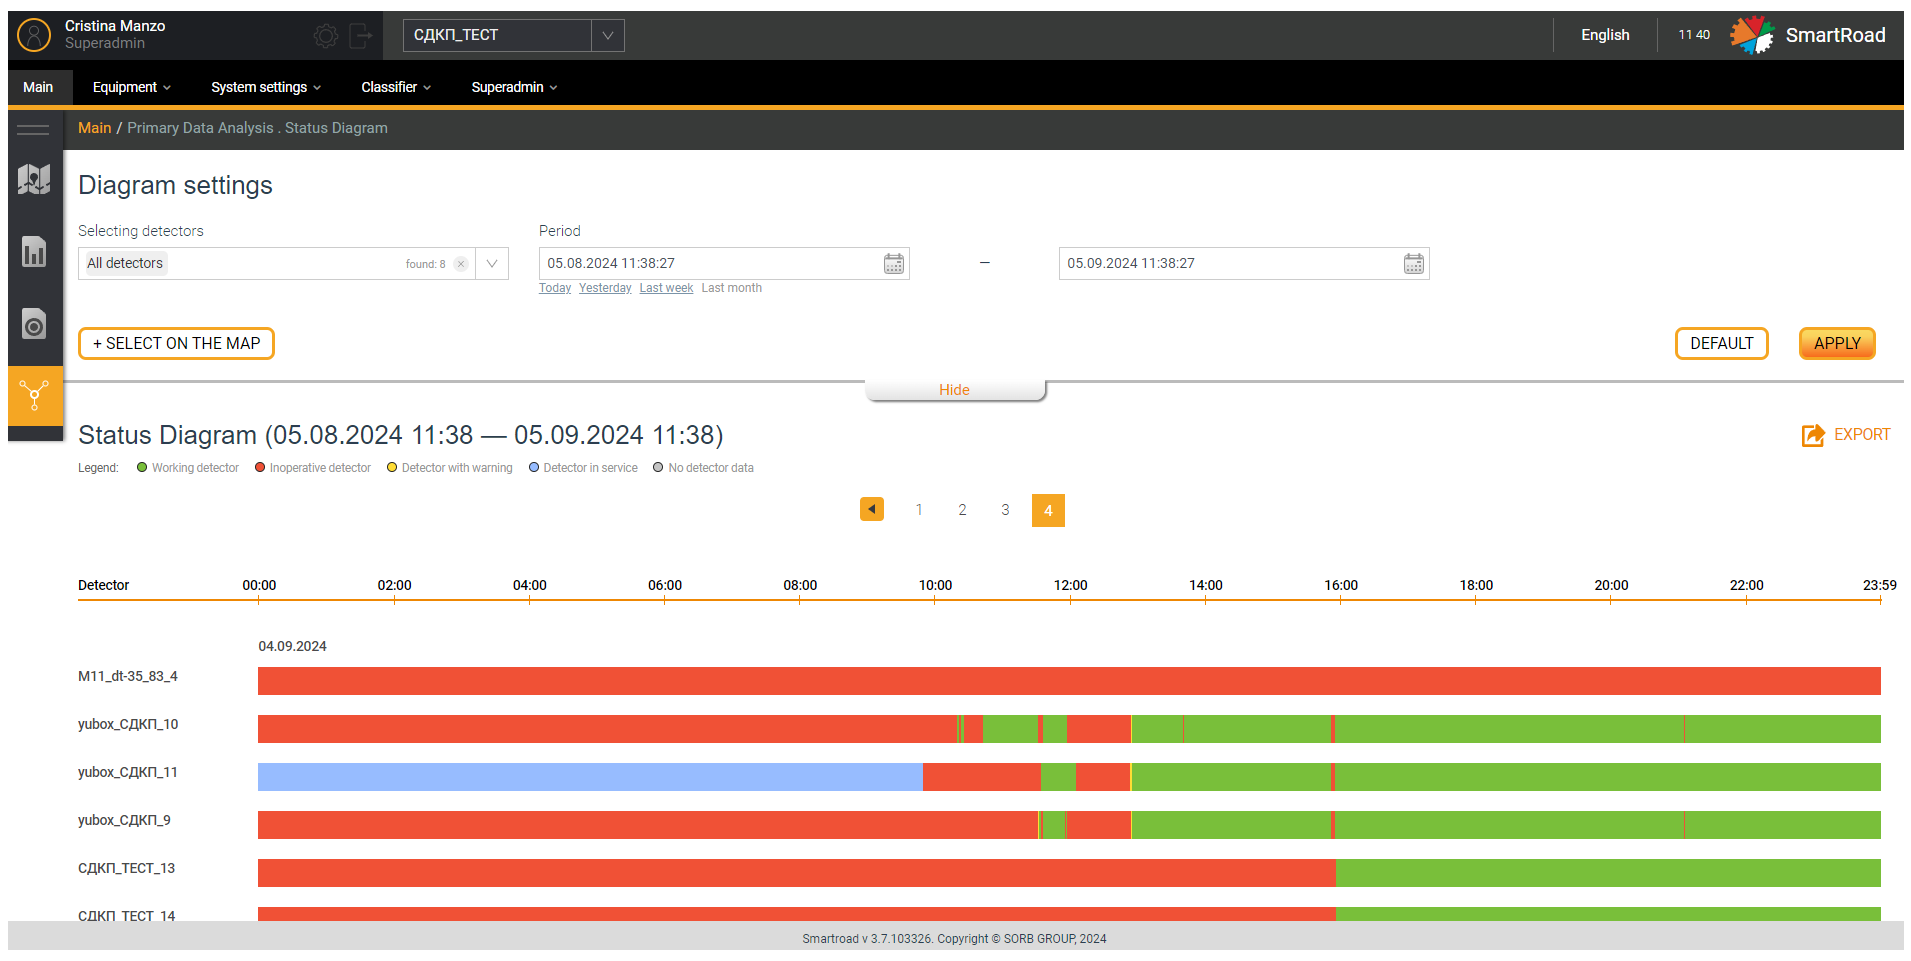
In the next table the parameters Description of the Status chart settings filter are indicated
| Parameter | Description |
|---|---|
| Selection of detectors | In the drop-down list, detectors are selected, based on the data from which a report will be generated. The field is a drop-down list with the ability to select several DTs. The choice of DT is carried out by checking the checkbox in the list. By default, all DTs are selected. |
| Period | The calendar indicates the date and time in the format from "HH.MM.YYYY HH: MM: SS" to "HH.MM.YYYY HH: MM: SS". Below the period entry field there are buttons for quickly selecting a period: Today, Yesterday, The last week and Last month. When you click on the quick period selection buttons, the System will automatically insert the selected period into the fields. |
| Select on map | Button for selecting detectors on the map. When the button is clicked, a pop-up window is shown with an interactive map for selecting detectors in the project. The selection is made in the same way as selecting detectors on the interactive map of the main page |
| Apply | Button for applying report generation parameters. When clicking on it, the system generates a report and displays it to the user |
| Reset | Filter parameters reset button. All filter parameters entered by the user are set to default values by clicking this button |
| Hide/Show | The button allows you to collapse and expand the filter section. |
Once completing the report generation, the System displays to the user report in two ways
- As a chart (located under the filter);
- And table (downloaded by clicking on the button
Exportin format Excel).
When user hovers the mouse over a line in the diagram, information about the detector pops up (% uptime, detector operating status and status time).
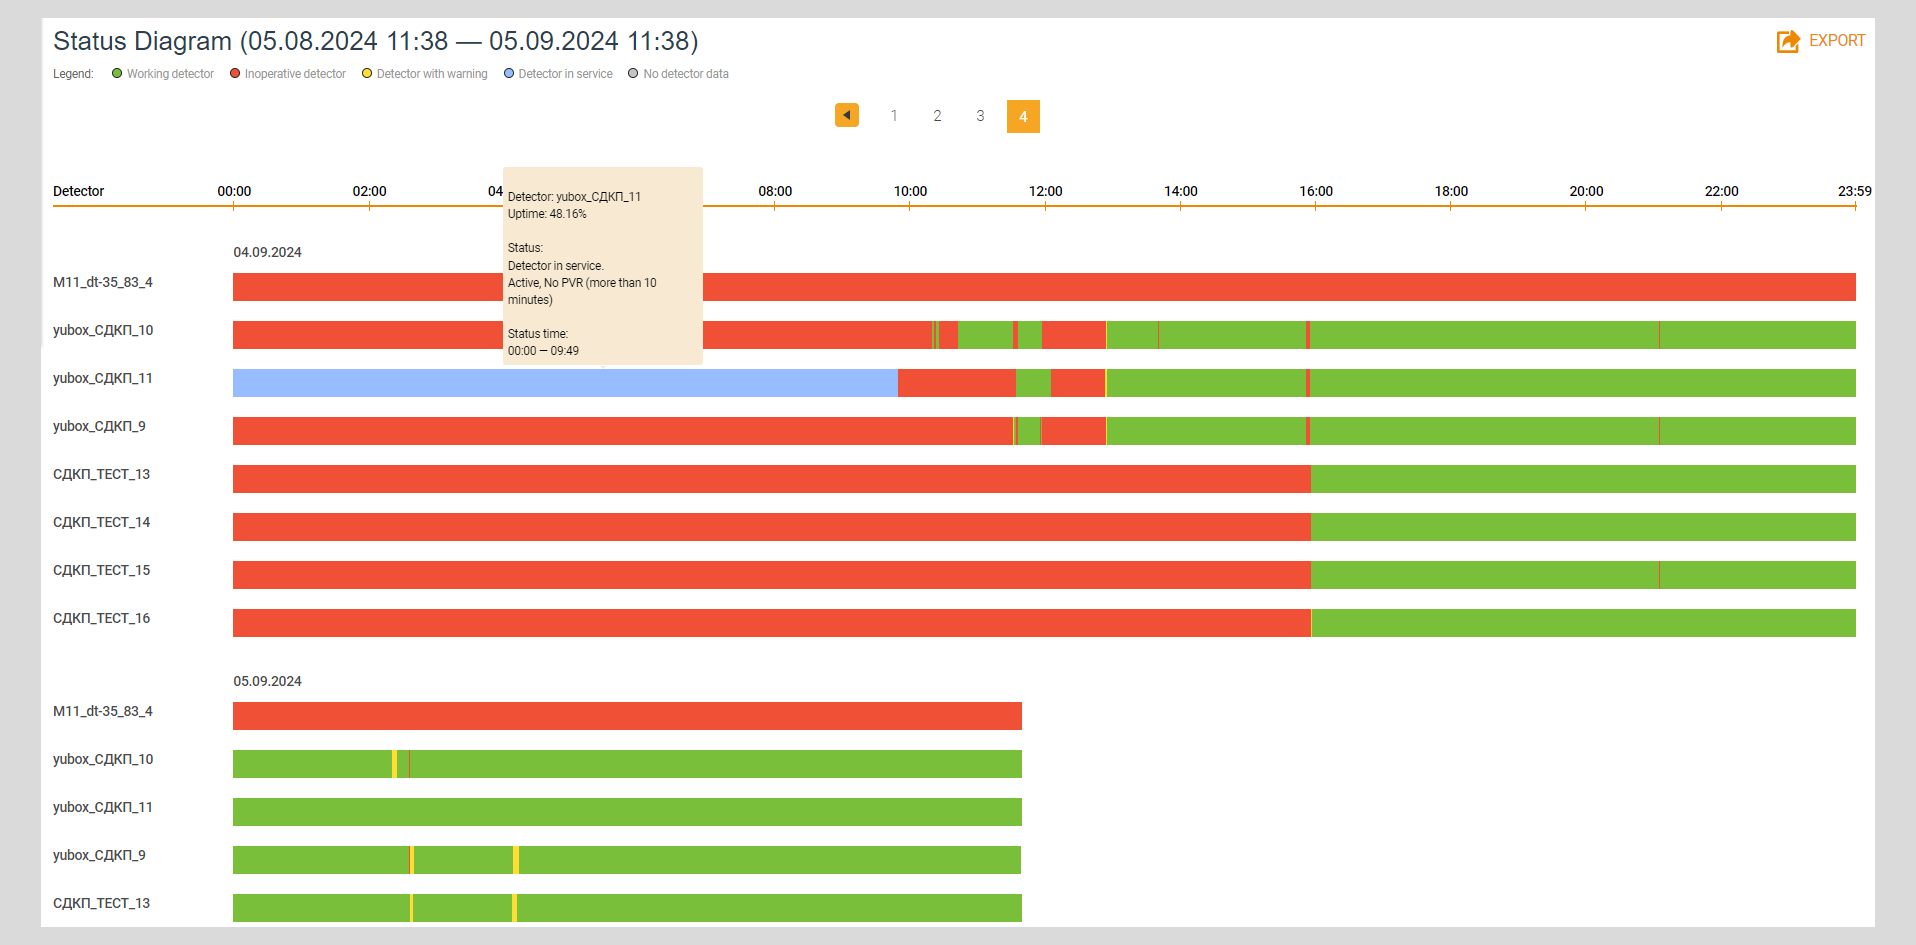
Green color indicates time intervals during which the detector operated without errors, yellow indicates time intervals during which the detector operated with minor errors, red indicates intervals during which the detector did not operate, blue indicates intervals when the detector was in adjustment, and light gray indicates the detector was removed from the project or moved to another project. When hovering over sections of the diagram, the operating statuses of the equipment recorded during operation of the detector are displayed to the user.
A window opens to select the format for exporting the Status chart data by clicking on the button Export.
