Events module
The events module provides event information on an interactive map. The module includes a section Events in the side navigation menu and the top menu item Event Rules.
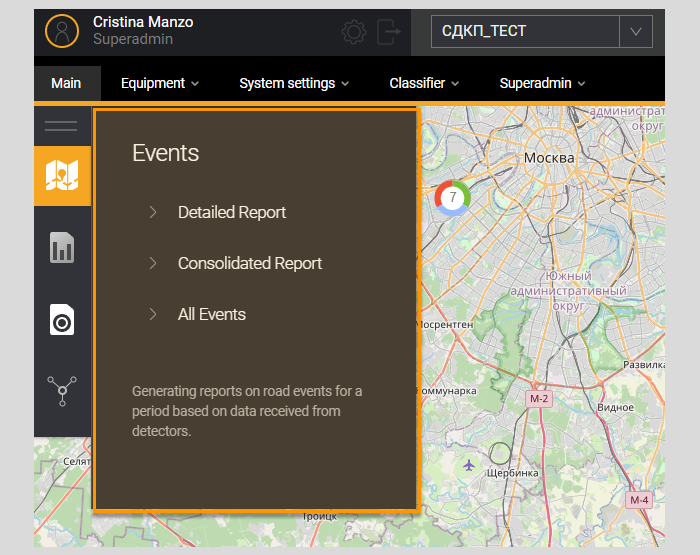
Section Events consists of subsections - Detailed report, Consolidated report and All events.
Event display
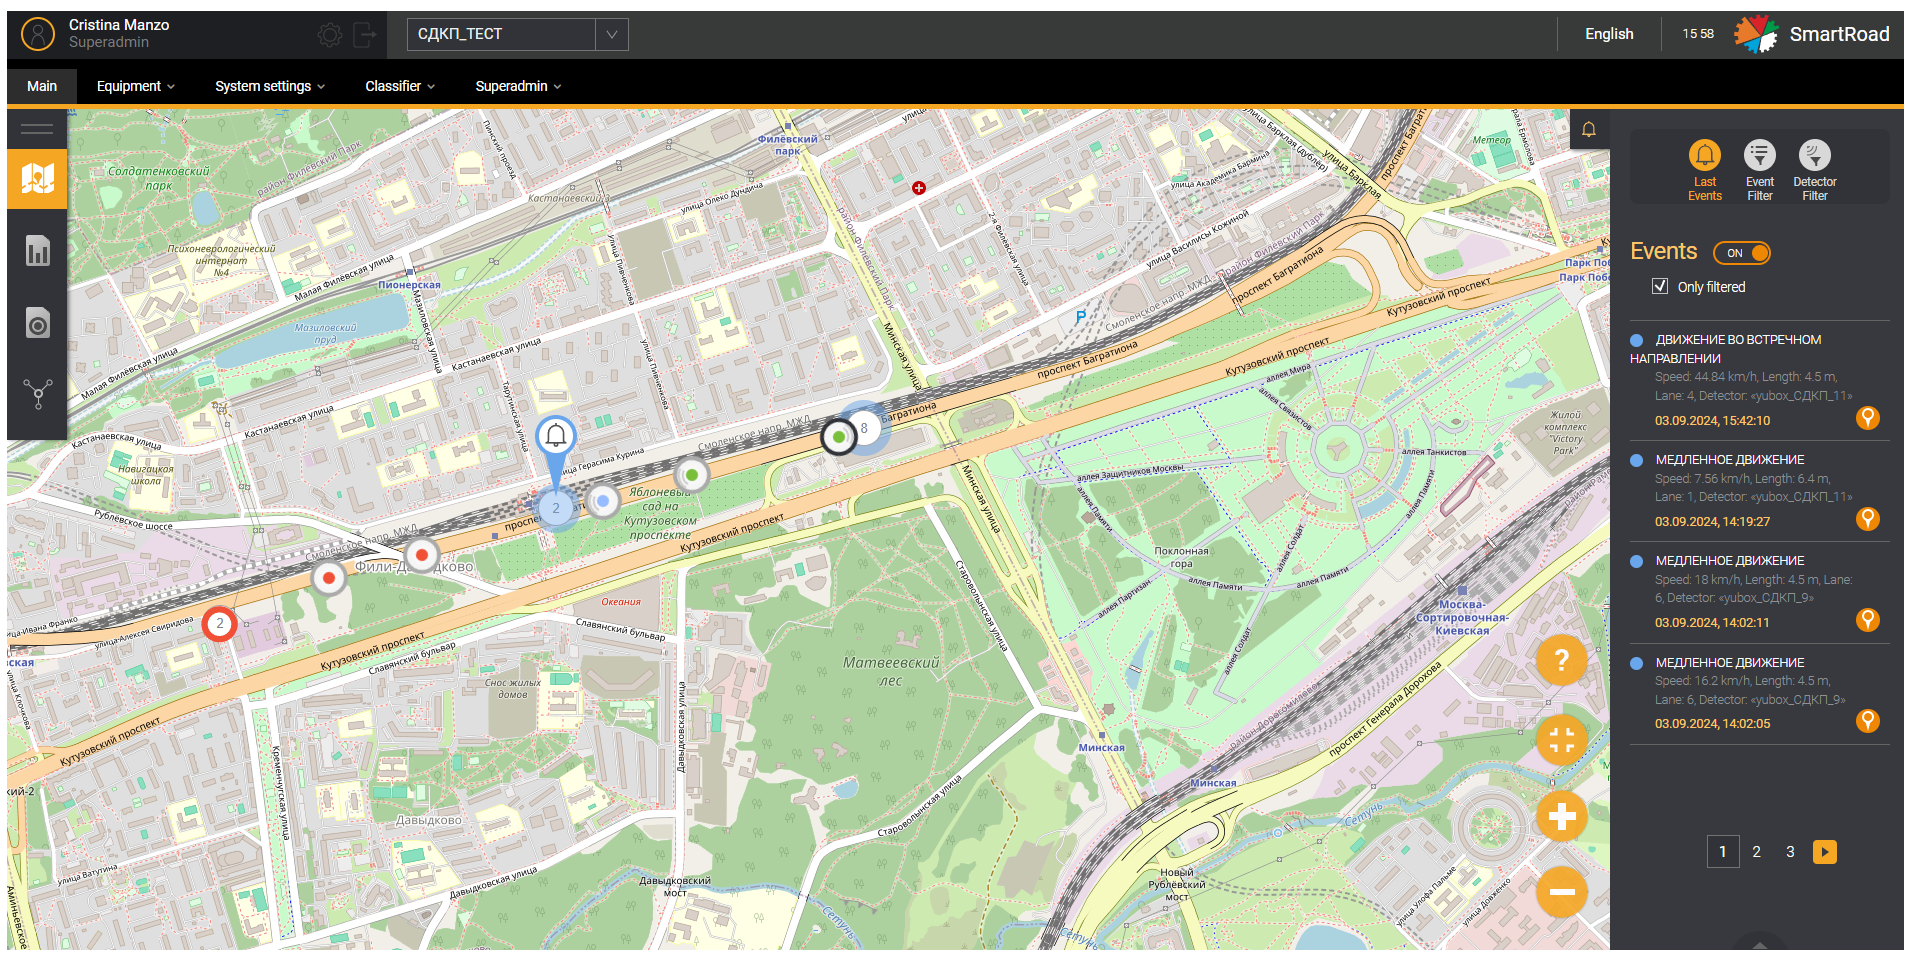
Events registered by the System are displayed on the map as icons. The color of an event indicates its category:
- Red – critical event
- Orange – event that requires attention
- Blue – information event
The web interface provides the following multi-filter functions To filter information on the map: Last Event widget, Latest Events list, Event filter.
Event information view
The user must hover over the event icon with the mouse pointer to view information about an event on the map. This will display a pop-up window with information about the event.
The Event information parameters are described in the table below
| Parameter | Description |
|---|---|
| Date and time in the window title | Date and time of registration of the event by the System |
| Event category | Event category. Possible options: - Information - Warning - Critical Event |
| Event Rule | The name of the event rule that captured the event |
| Speed | Speed of object movement during registration events |
| Length | Length of the object participating in the event |
| Band | Object movement lane during registration events by the System |
| Detector | Name of the detector that recorded the occurrence of the event |
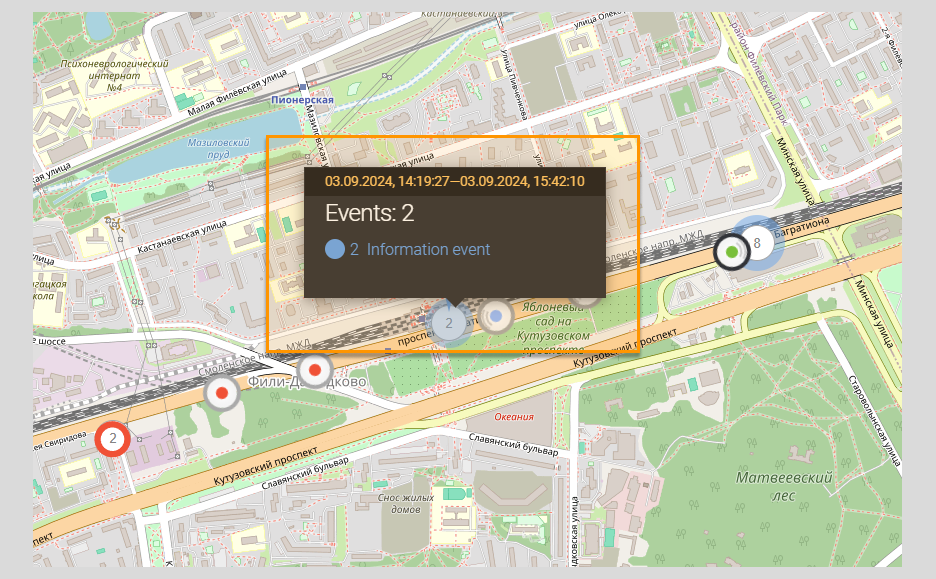
When you hover over the event group area on the map, a pop-up information window will appear with general information about all the events that occurred at that location on the interactive map.
Detailed event report
A detailed report provides the user with event information collected by one detector over a specified period of time. The report is generated after the user enters the necessary parameters in the report filter, based on which the data is selected.
Report settings for the Detailed report
The Page Report settings for Event Detailed report is a filter for entering report parameters. The user must fill in the required filter fields (marked in orange) to build a report.
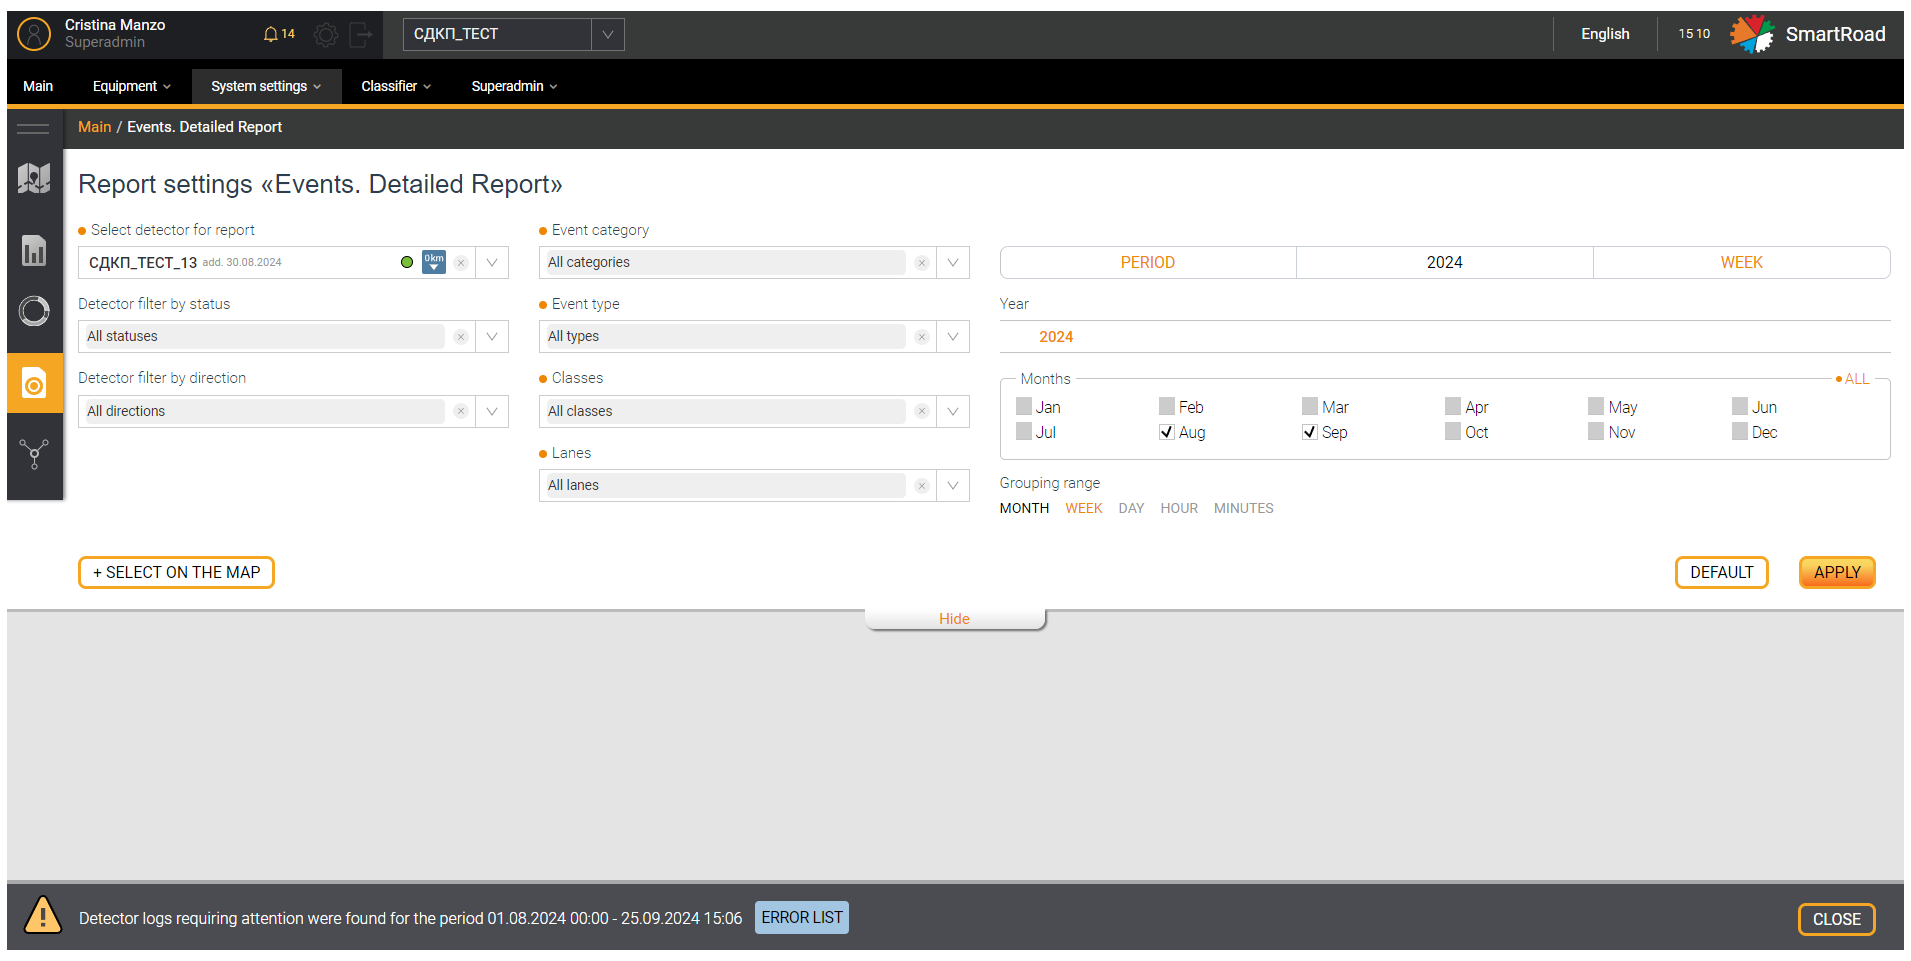
In the table below you will find the Detailed event report filter parameters
| Parameter | Description |
|---|---|
| Selecting a detector to report * | In the drop-down list, select the detector based on the information from which the report will be generated. Detectors that relate to the selected project are available for selection in the drop-down list. Only one detector can be selected. By default, no detector is selected. |
| Filter detectors by status | This filter is designed to filter detectors by operating status. In the drop-down list, select the operating status of the equipment by checking the checkbox. After specifying the statuses, the condition is applied to the field Selecting a detector to report. By default, all equipment statuses are selected |
| Filter detectors by direction (multiple selection list) | This filter is designed to filter detectors by direction. In the drop-down list, select the detector direction by setting checkboxes. After specifying the direction, the condition is applied to the field Selecting a detector to report. By default all directions are selected |
| Event Category * (Multiple choice list) | Use the drop-down list to select the categories of events included in the report. A checked checkbox indicates that the category is included in the report. Multiple values can be selected. By default, all categories are selected. |
| Event type * (multiple selection list) | Use the drop-down list to select the types of events included in the report. A checked checkbox indicates that the type is included in the report. By default, all event types are selected. |
| Classes * (multiple choice list) | In the drop-down list, you select the classes of objects registered by the System to be included in the report. A checked checkbox indicates that the object class is included in the report. By default, all classes are selected. |
| Stripes * | Use the multiple selection drop-down list to select which lanes to include in the report. A checked checkbox indicates that the band is included in the report |
| Other parameters * | In the multiple selection drop-down list, you select the parameters included in the report: - Speed 85%, km/h - Workload - Movement interval, sec |
| Period * (multiple choice list) | An arbitrary period for which the report will be generated. The calendar displays dates and times in the format "HH.MM.YYYY HH:MM:SS" to "HH.MM.YYYY HH:MM:SS". Below the period entry field there are buttons for quickly selecting the period Today, Yesterday and Week ago. By clicking on the quick period selection buttons, the System will automatically substitute the selected period. |
| YEAR/MONTH | Buttons for selecting the year and month/months (checkboxes) for selecting the period for which the report will be built. |
| SUNDAY | In the drop-down list, select the week for which you want to build a report. |
| Grouping interval * | Interval of time grouping of data. Use the buttons to select the intervals for which the data within the selected period will be broken down in the report. |
| +Select on map | Button for selecting a detector on the map. By clicking on the button, the user is shown a pop-up window with an interactive map for selecting a detector to build a report. The selection is made in the same way as selecting a detector on the map of the main page. You can select a detector by checking the desired checkbox on the left. |
| Apply | Button for applying report generation parameters. By clicking on the button, the system generates a report and provides it to the user |
| Reset | Filter parameters reset button. By clicking on the button, all filter parameters entered by the user are returned to their default values |
| Hide/Show | The button allows you to collapse and expand the filter block. |
(*) - It is Required parameter to build a report
Grouping interval- the selected time interval should not exceed 24 hours to generate a report in hours or minutes
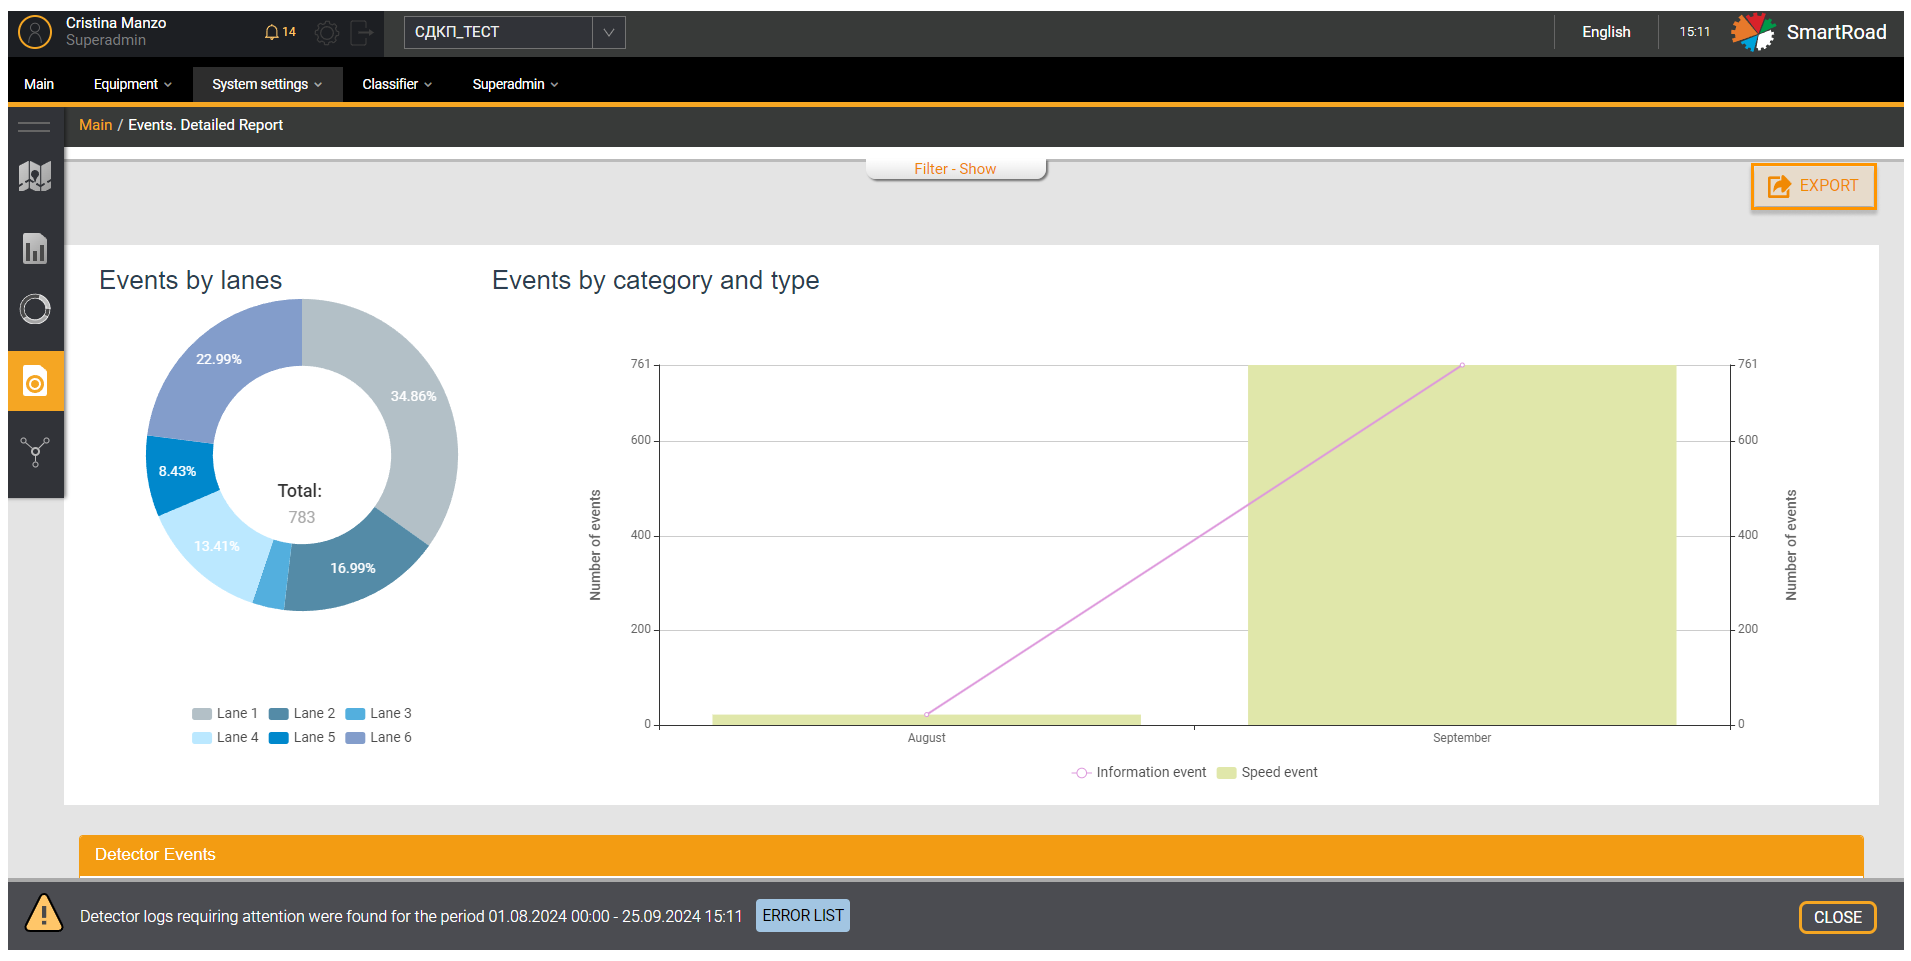
Graphic part of a detailed event report
The user can view the information in graphical form after generating the report. The graph is an interactive element. When hovering the mouse over the chart elements, the user is shown additional information in the form of tooltips.
Tabular part of a detailed event report
The information collected in the report is displayed to the user in the form of a table. Information is displayed for each step of the selected data grouping interval.
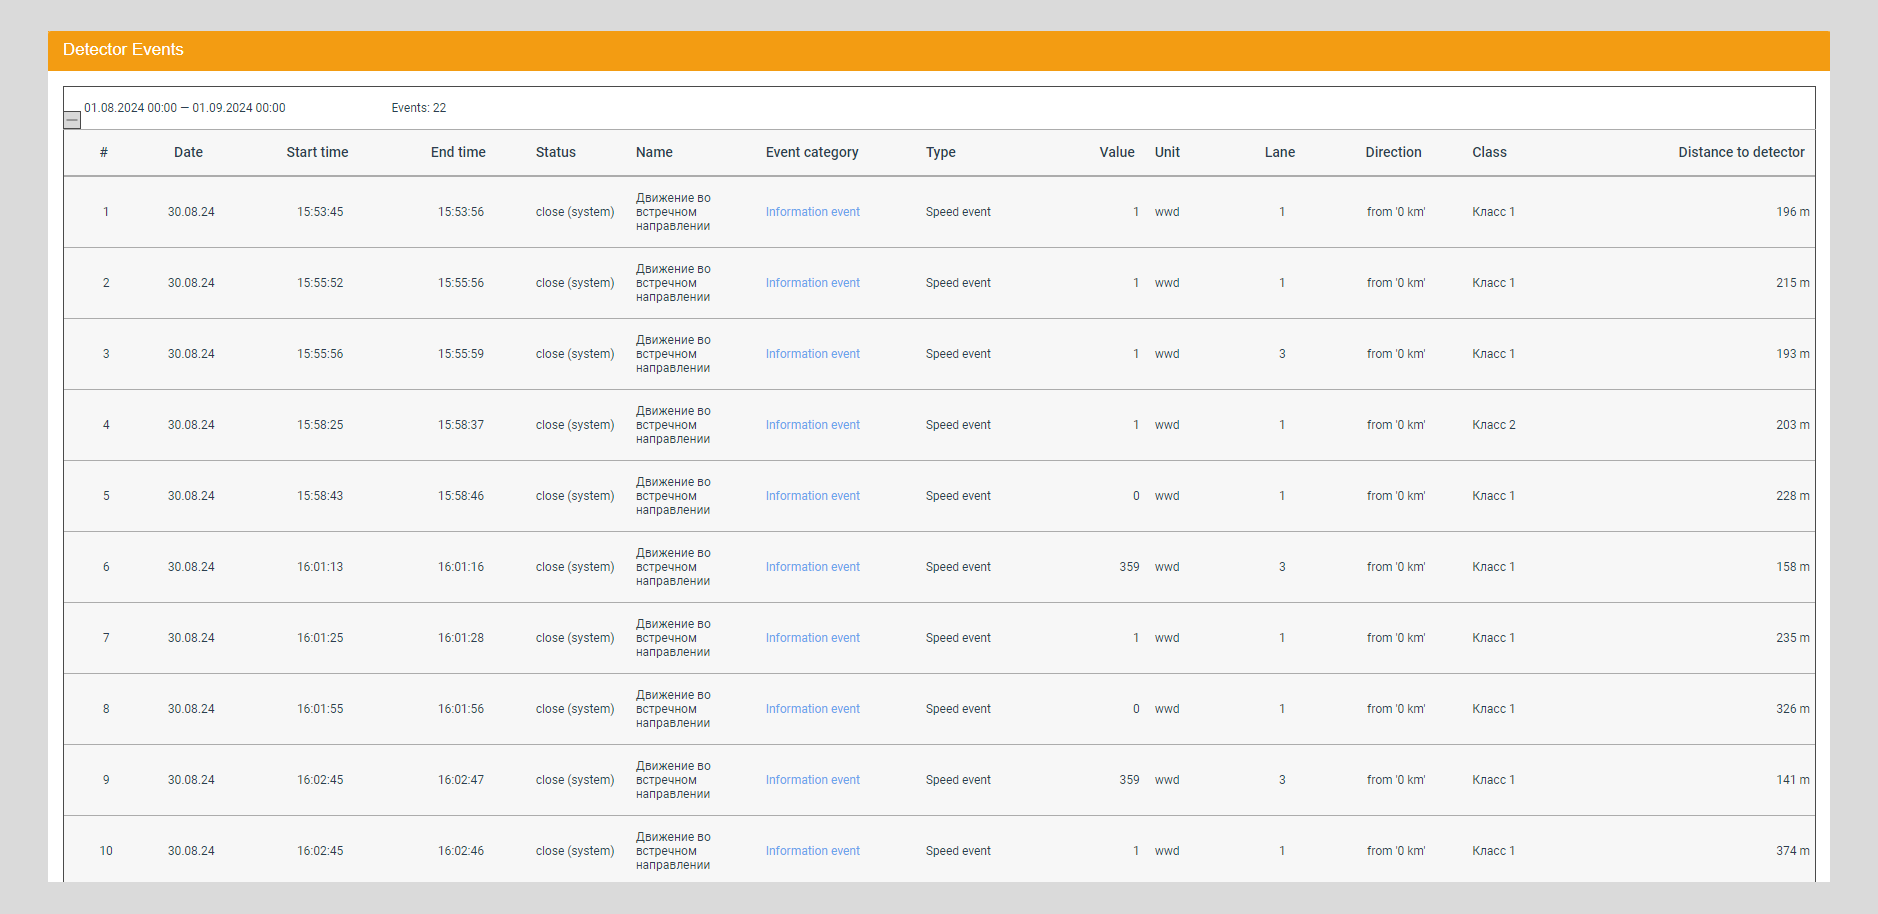

In the table below you can find the Parameters of the tabular part of the detailed event report.
| Parameter | Description |
|---|---|
| Date | Date and time interval for which data is displayed |
| Events | Total number of events for the selected time interval |
Each report step can be expanded by clicking on the corresponding + icon. In this case, the user is provided with additional information on events registered by the System.
The additional information parameters of the detailed event report are described here
| Parameter | Description |
|---|---|
| # | The serial number of the entry in the list |
| Date | Date of event registration by the System |
| Start time | Event start time recorded system |
| End time | Event end time recorded system |
| Status | Status of the event in the System when generating the report: - open - event being processed, - close – closed by the operator, - close (auto) - closed automatically |
| Name | Name of the rule that recorded the event. Examples: - Speed <15 - Wrong direction - Stop |
| Event category | Event category specified in the System during setup: - Information - Warning - Critical event |
| Type | The event type specified in the System when setting up the event rule: - Speed events - Traffic Events - Other events |
| Meaning | The quantitative value of the indicator that was registered by the event. The value received from the detector: - at a speed event – the speed of the object; - when stopping – zero; - when moving back - one. |
| Unit of measurement | Unit of measurement of the indicator that was registered through the event: - CUSTOM – custom event - GAP - interval - HEADWAY – forward direction - KMH - km/h - MPS-м/с - PEDESTRIAN – pedestrian detected - PLACE - object in the definition area - STOP - stopping vehicle - WWD - wrong direction |
| Band | Lane where the event was registered |
| Direction | Lane direction |
| Class | The class of the object participating in the event. Classes of road objects are set in Classes of road objects |
| Detector distance | Distance to the detector where the event was recorded |
Besides, the Final report parameters
| Parameter | Description |
|---|---|
| Total events per interval | Total number of events per time interval by directions of movement, categories and types of events |
| Total events by detector for the period | Total number of events for the time interval selected in the report filter |
| Total detector unavailability time | The total time during which the sensor was unavailable during the time interval selected by the filter. Displayed in days, hours, minutes format |
| Trouble-free operation of the detector | The value of uninterrupted operation of the sensor as a percentage for the time interval selected in the filter. Percentage value (%) |
| Data Collection Integrity | The value of uninterrupted data acquisition from the detector for the entire time of its uninterrupted operation for the period selected in the filter. Percentage value (%) |
Consolidated event report
A consolidated report provides the user with information on events collected by several detectors over a specified period of time. The report is generated after the user enters the necessary parameters in the report filter, based on which the System selects the data.
Report settings for the Consolidated report
The Page Events report settings. Consolidated report is a filter for entering report parameters. The user must fill in the required filter fields (marked in orange) to build a report.
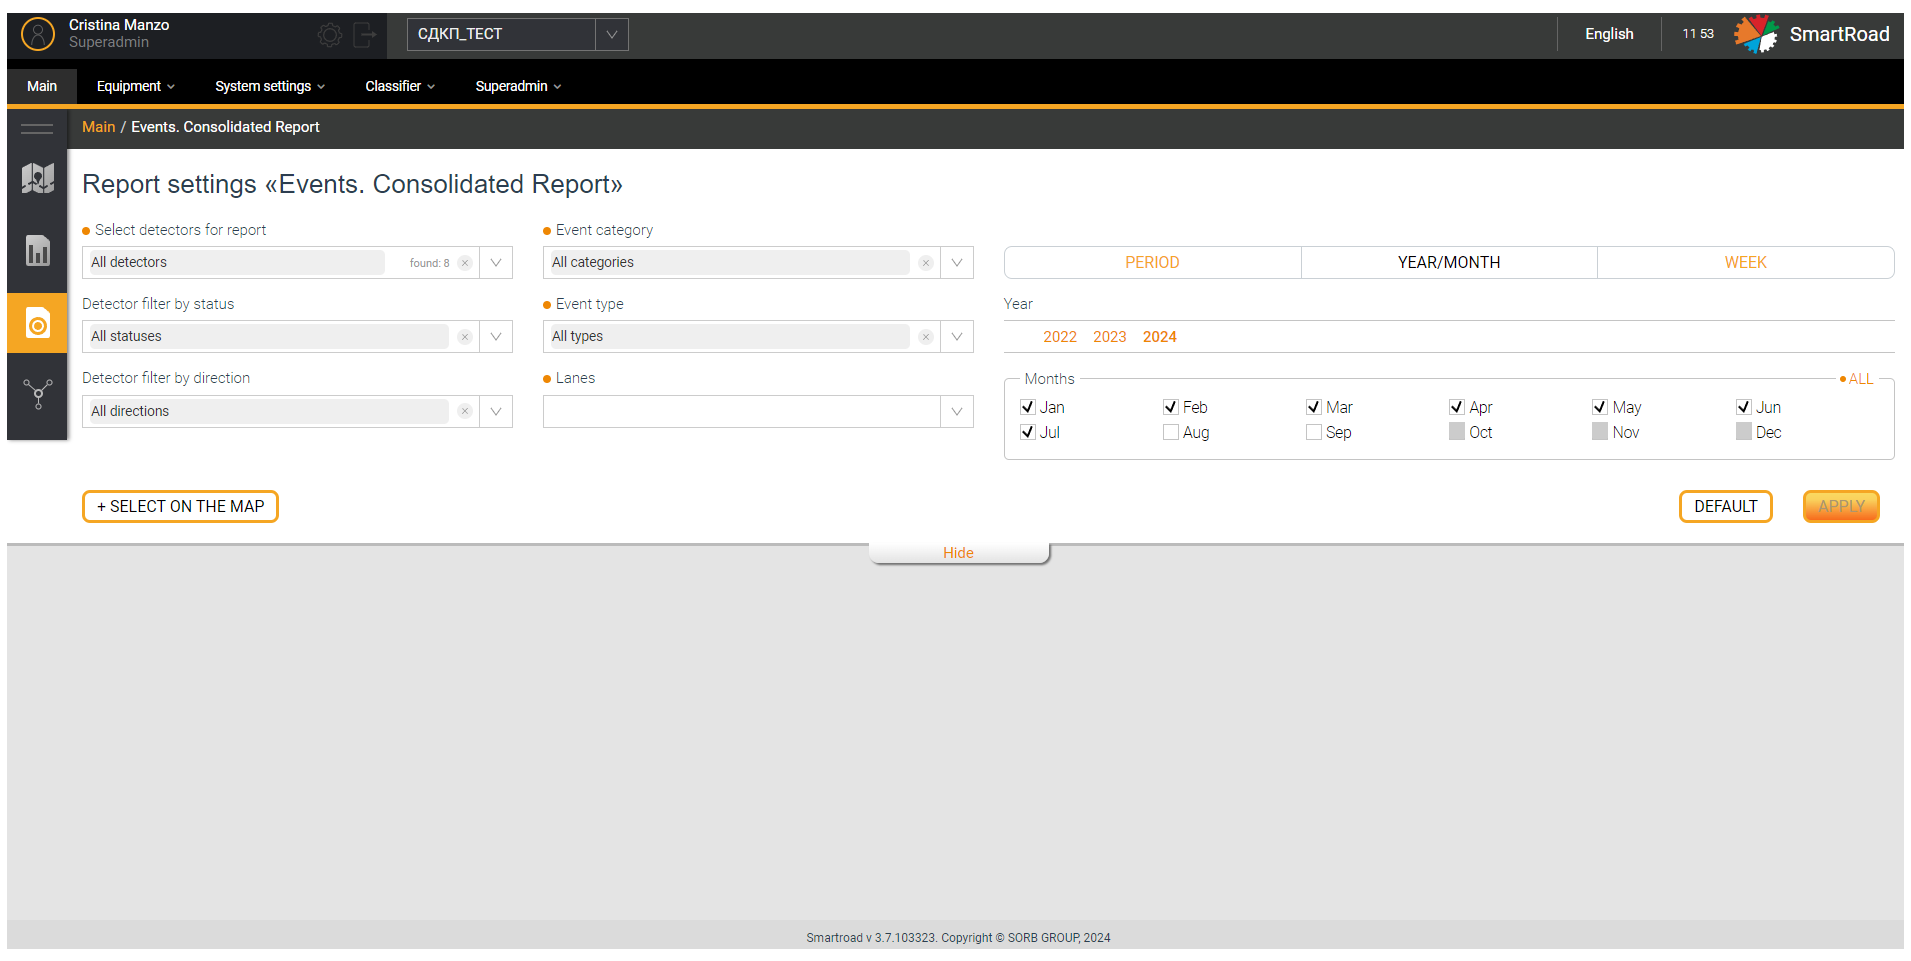
In the next table are described the Events filter parameters for the Consolidated report
| Parameter | Description |
|---|---|
| Select detectors for report * (multiple selection list) | In the drop-down list, by setting the checkbox, you select detectors, based on the information from which the report will be generated. Detectors that relate to the selected project are available for selection in the field. By default, all detectors are selected. |
| Filter detectors by status (multiple selection list) | This filter is designed to filter detectors in the “Select detector for report” field by operation status. In the drop-down list, select equipment statuses by checking the checkbox. After specifying the statuses, the condition is applied to the field Selecting detectors to report. By default, all equipment statuses are selected. |
| Filter detectors by direction (multiple selection list) | This filter is designed to filter detectors in the Select detector for report field by direction. In the drop-down list, select the detector direction by setting checkboxes. After specifying the direction, the condition is applied to the Select detectors for report field. By default all directions are selected |
| Event Category* (multiple selection list) | This field allows you to select the categories of events included in the report: - Information - Warning - Critical event A checked checkbox indicates that the category is included in the report. By default, all event categories are selected. |
| Event type* (multiple selection list) | This field selects the types of events included in the report. A checked checkbox indicates that the type is included in the report. By default, all event types are selected. |
| Stripes* (multiple choice list) | The field selects the traffic lanes included in the report. A checked checkbox indicates that the band is included in the report. All bands are selected by default |
| Period * | An arbitrary period for which the report will be generated. The calendar indicates the date and time in the format from “HH.MM.YYYY HH:MM:SS” to "HH.MM.YYYY HH:MM:SS". Below the period entry field there are buttons for quickly selecting the period Today, Yesterday and Week ago. By clicking on the quick period selection buttons, the System will automatically select the period. |
| YEAR/MONTH | Buttons for selecting the year and month/months (checkboxes) for selecting the period for which the report will be built. |
| SUNDAY | In the drop-down list, select the week for which you want to build a report. |
| Grouping interval* | Interval of time grouping of data. Use the buttons to select intervals into which the data will be divided within the selected period in the report. |
| +Select on map | Button for selecting a detector on the map. By clicking on the button, the user is shown a pop-up window with an interactive map for selecting a detector. The selection is made in the same way as selecting a detector on the map in the main page |
| Apply | Button for applying report generation parameters. By clicking on the button, the system generates a report and displays it to the user |
| Reset | Filter parameters reset button. By clicking on the button, all filter parameters entered by the user are returned to their default values |
| Hide/Show | The button allows you to collapse and expand the filter field |
(*) - It is Required parameter to build a report
Grouping interval- the selected time interval should not exceed 24 hours to generate a report in hours or minutes
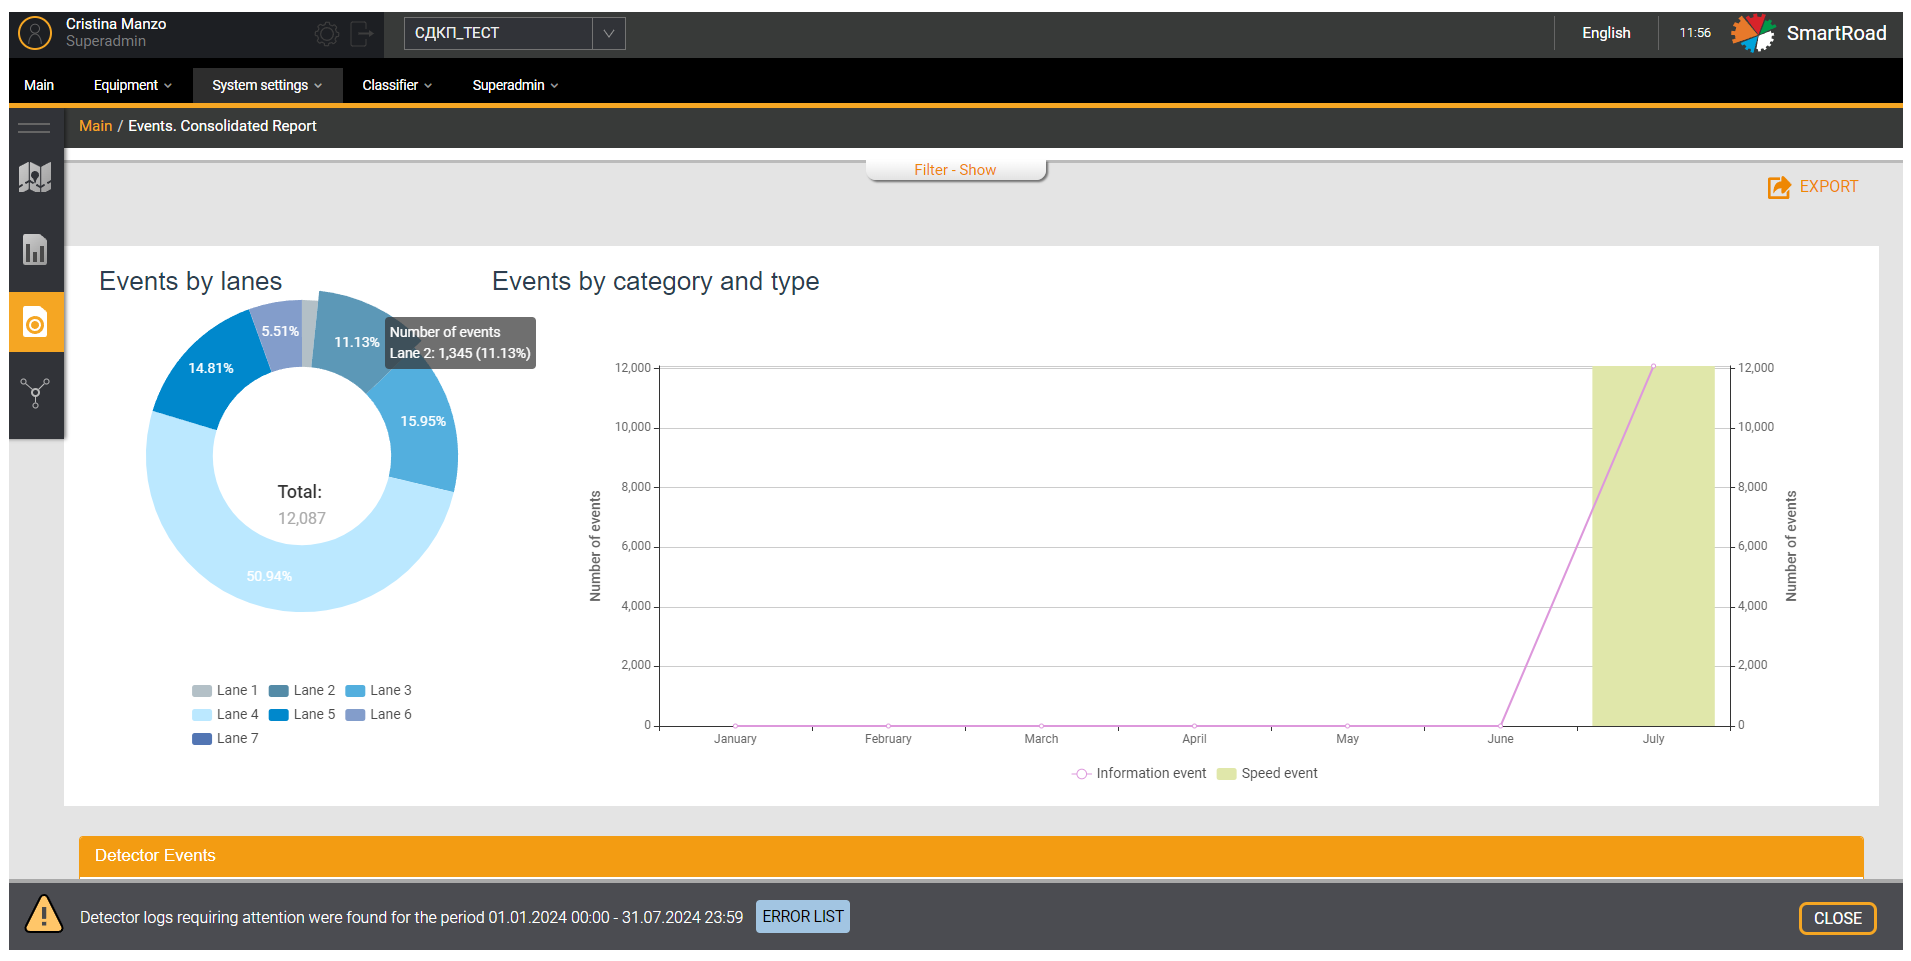
Consolidated event report chart
The user can view the information in graphical form after generating the report. This graph is an interactive element. When you hover your mouse over chart elements, additional information is displayed in the form of tooltips.
Tabular part of the consolidated event report
The graphical portion of the information collected in the report is displayed in the form of a table.
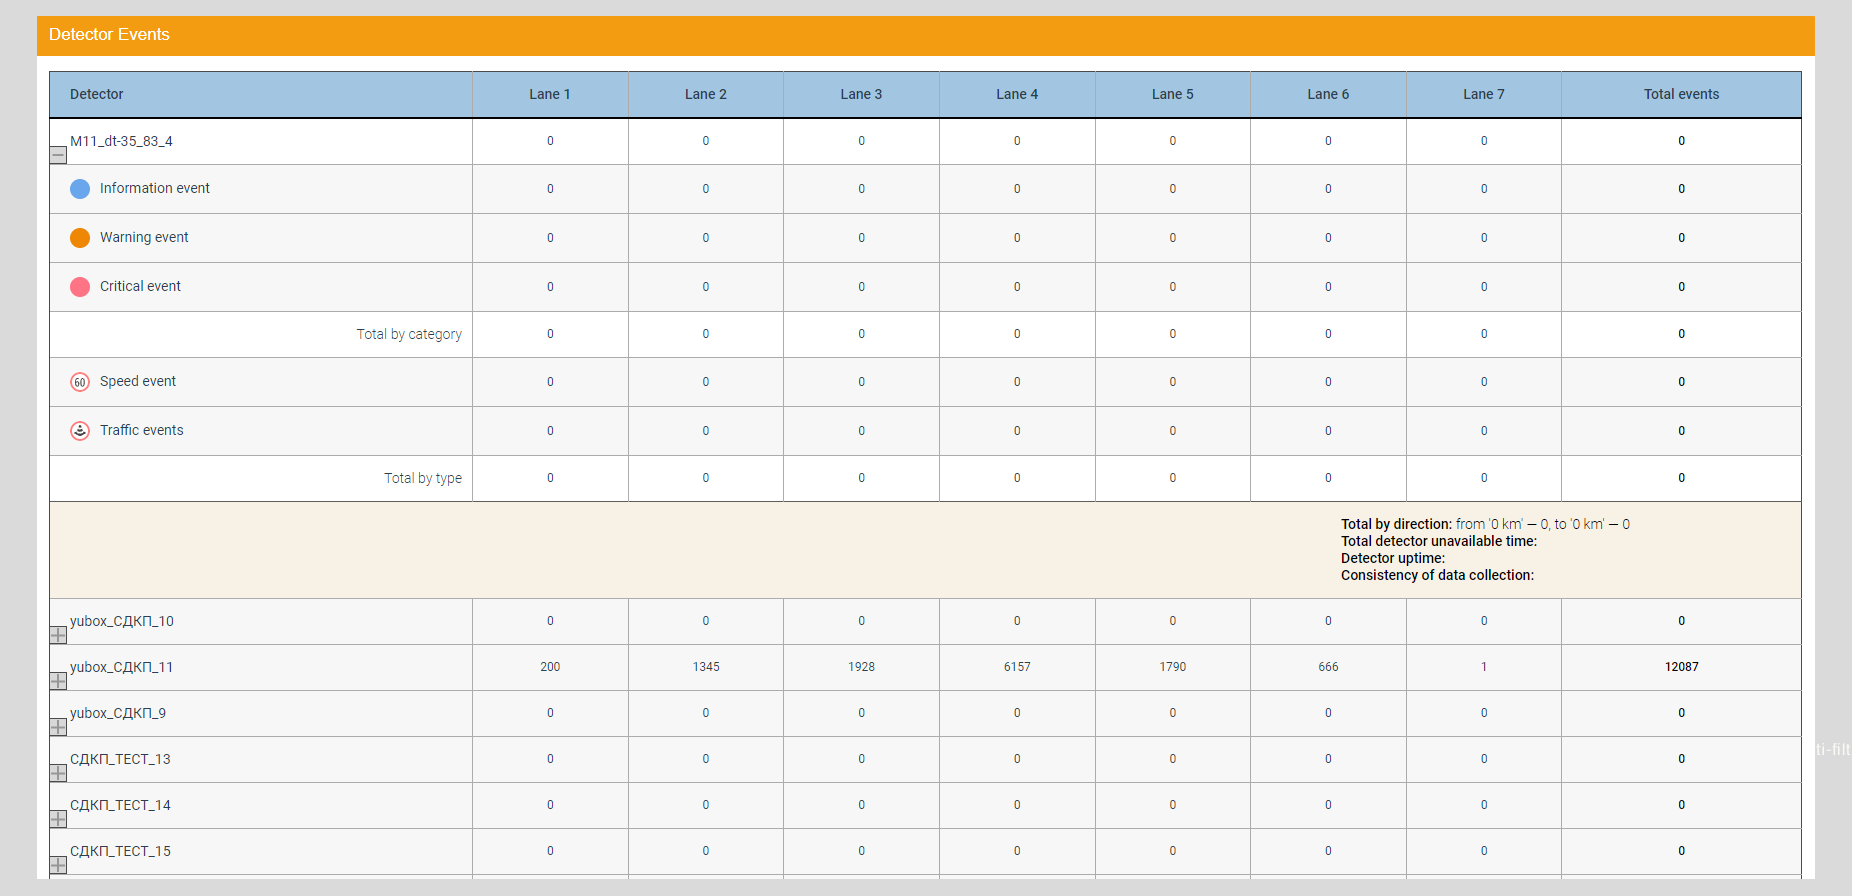
The table below indicates the Parameters of the tabular part of the consolidated event report.
| Parameter | Description |
|---|---|
| Detector | Name of the detector that collected the data |
| Lane No. (where No. is the lane number) | Number of events recorded on the lane by the detector |
| Total events | Total number of events per detector |
| Total events (result string) | Total number of events for all detectors included in the report, broken down by direction of motion, category, and event type |
Lines with information for each detector can be expanded by clicking on the corresponding + icon. In this case, the user is provided with additional information on registered events.
Furthermore, you will see the Parameters of additional information in the tabular part of the consolidated event report
| Parameter | Description |
|---|---|
| Event categories | Number of events by category, registered in each lane: - Information - Warning - Critical event |
| Total by category | Total number of events in all categories for each lane |
| Event Types | Number of events by type recorded in each lane - Speed Events - Traffic events - Other events |
| Total by type | Total number of events for all types for each lane |
| Total by directions | Total number of events by area. Movements (from 0 km –, to 0 km –) |
| Total detector unavailability time | The total time during which the detector was unavailable during the time interval selected in the filter. Displayed in days, hours, minutes format |
| Trouble-free operation of the detector | The value of uninterrupted operation of the detector as a percentage for the time interval selected in the filter. Percentage value (%) |
| Data Collection Integrity | The value of constant and uninterrupted data acquisition from the detector for the entire time of uninterrupted operation of the detector for the period selected in the filter. Percentage value (%) |
Exporting event reports
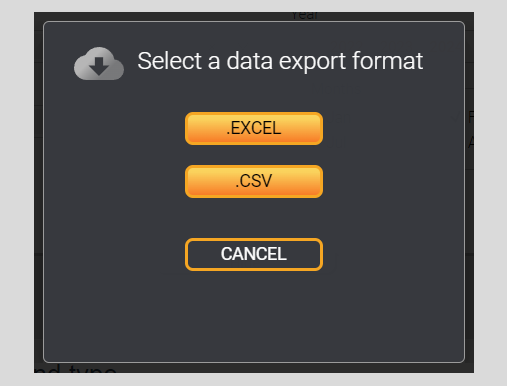
Event reports can be uploaded to an external file of the selected format. The System must complete its generation to upload a report. Uploading is done using the Export button located on the right, above the graphic part of the report. When clicked, the user can select the file format in which the information will be saved. Available formats:
- Excel
- CSV
All events
This All events functionality is being developed currently.
The page All events contains a list of all events registered by the system for the selected project. On the page, the user has access to a filter for searching for events in the list, as well as a list of all events registered in the System.
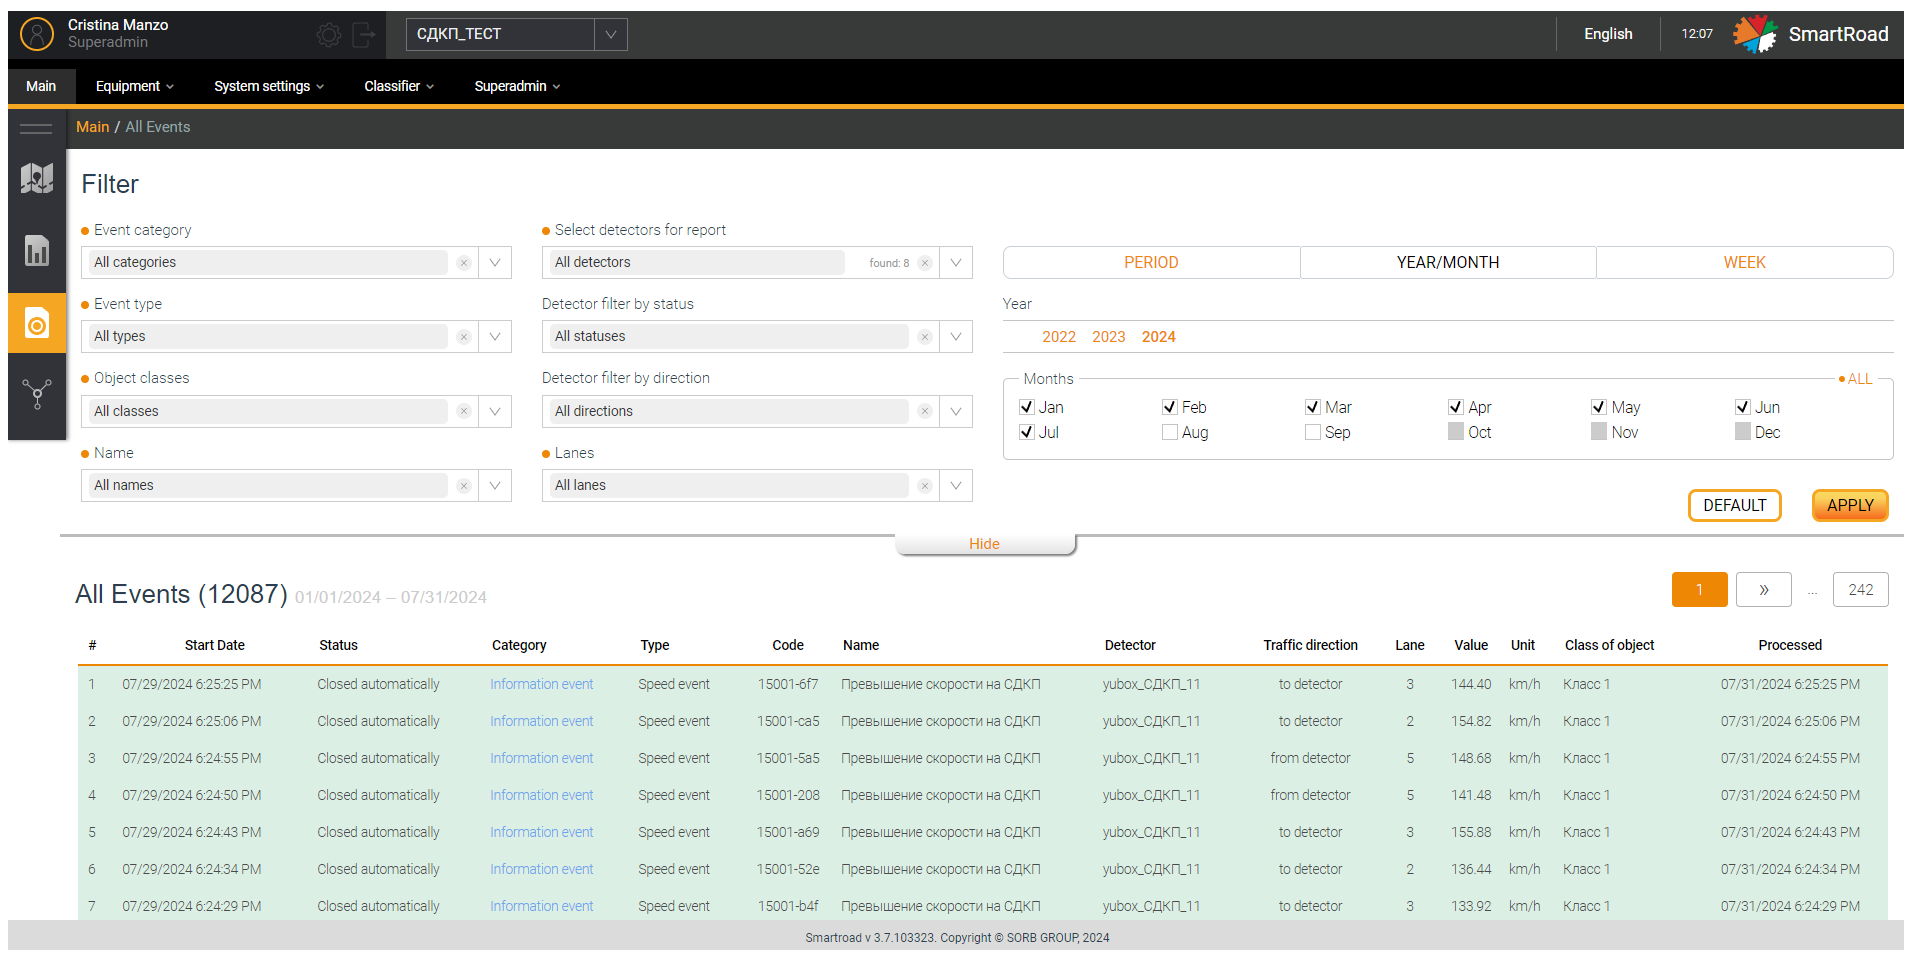
In the next table you will find the Event list filter parameters
| Parameter | Description |
|---|---|
| Event Category* (multiple selection list) | When you click on the drop-down list, the user is shown a list of event categories registered in the System. The choice is made by setting a checkbox. All categories are selected by default |
| Event type* (multiple selection list) | The drop-down list displays a list of event types registered in the system. The choice is made by setting the checkbox |
| Vehicle classes* (list with multiple choice) | When you click on the drop-down list, the user is shown a list of vehicle classes registered by default in the System. The choice is made by setting a checkbox. All categories are selected by default |
| Name* | When you click on the drop-down list, the user is shown a list of event names registered in the System |
| Selecting detectors for the report*(multiple choice list) | In the drop-down list, detectors that registered events are selected. Detectors that relate to the selected project are available for selection in the field. By default, all detectors are selected. |
| Filter detectors by status (multiple choice list) | The drop-down list displays the operating status of the detector. By default, all statuses are selected. |
| Filter detectors by direction (multiple choice list) | The drop-down list displays the detector directions: - to 0 km; - from 0 km; - round trip By default, all directions are selected. |
| Stripes* (multiple choice list) | In the drop-down list you can select bands (band numbers) registered in the System. By default, all bands are selected. |
| Period* (multiple choice list) | An arbitrary period for which a list of events registered in the System will be displayed. The fields indicate dates and times in the format from “HH.MM.YYYY HH: MM: SS” to “HH.MM.YYYY HH: MM: SS”. Below the period entry field there are buttons for quickly selecting a period Today, Yesterday and A week ago. When you click on the quick period selection buttons the System will automatically substitute the period. |
| Apply | Button for applying filtering parameters. By clicking on the button, the system generates a list of events and displays it to the user |
| Reset | Filter parameters reset button. When you click on it all user entered filter parameters are returned to default values |
| Hide | The button allows you to collapse and expand the filter block |
(*) - It is mandatory field
Besides, All Events list options
| Parameter | Description |
|---|---|
| # | Record serial number |
| start date | Event start date |
| Status | The System has the following event statuses: - New - Viewed - In progress - Closed by operator - Delegated - Closed automatically |
| Category | The System provides the following categories of events: - Information - Warning - Critical event |
| Type | The registered event is displayed: - Speed events - Traffic events - Other events |
| The code | Unique event code assigned in the System |
| Name | The name of the event rule that recorded this even |
| Detector | Detector name |
| Direction of movement | Detector direction: - to the detector - from detector. |
| Band | Number of the band in which this event was recorded |
| Meaning | Event parameter value |
| Unit measurements | Event parameter unit |
| Vehicle class | The class of the object participating in the event. Road object classes are specified in the top menu in Road object classes |
| Processed | Event completion (processing) date |
The card of the selected event will open by clicking on any line of the list. Detailed description in the section Event card.
---------------Отсюда из бывшего модуля принятия решений------------------------------------------------------------------
Decision-making module
This module is designed to provide information to users making decisions in difficult conditions for a complete and objective analysis of the road situation. The purpose of this module is to assist users in making decisions, for example, informing external systems about an event or incident and transmitting data about the event or incident to external systems.
The modules provides:
- Event processing
- Information related to an event registered in the System in the event card.
- Photos and videos from a camera on the section of the road where the event occurred.
- The option for reproducing (play) an event in the graphical configurator (except for events identified by indirect evidence).
Event to process
The Modal window Event to process is an event processing window. It gives brief information about the event and enables the operator to change the event status and go to the Event Card window.
You can go to modal window Event to process by clicking on the icon on the top panel Notification of a recorded event. The number of events to process is indicated in parentheses at the top of the modal window.
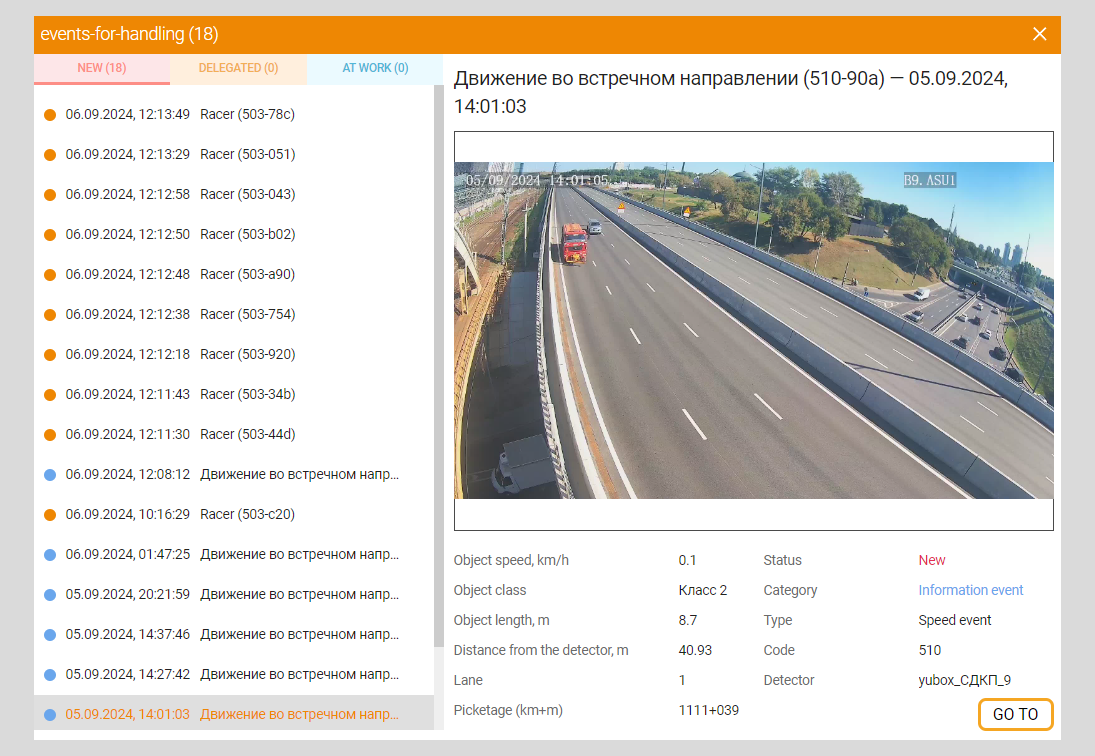
In the next table the Parameters of the Events for processing modal window are described
| Parameter | Description |
|---|---|
| New | New event for operator processing |
| Delegated | Delegated event for operator processing |
| In progress | Events that the operator is working on |
| Rule name | Name of the event rule, captured event |
| Time and date | Date and time of the recorded event |
| Block with media data | Photo or video file of the event |
| Object speed, km/h | The speed of the object at the time of the event |
| Object class | Class of the object participating in the event |
| Object length, m | Length of the object participating in the event |
| Distance from detector, m | Distance from the detector at the time of the event |
| Band | The bar on which the event was recorded |
| Picketage (km+m) | Picketing before the event |
| Status | Log status for this event |
| Category | The field displays the category of this event to the user: - Information - Warning - Critical Event |
| Type | In the drop-down list, the user is shown a list of event types registered in the system: - Speed events - Traffic events - Other events |
| The code | Unique event code assigned in the System |
| Detector | Detector name |
| Go button | Click to go to the card of the selected event |
| Close button | It is used to close modal window |
Event card
This functionality is being developed currently
The Page Event Card contains information with data on the selected event in the list of all project events. When you click on an event in the list, the card of the selected event opens. The event card also contains photos and videos from the nearest camera and a link to go to the graphical configurator to play the event.
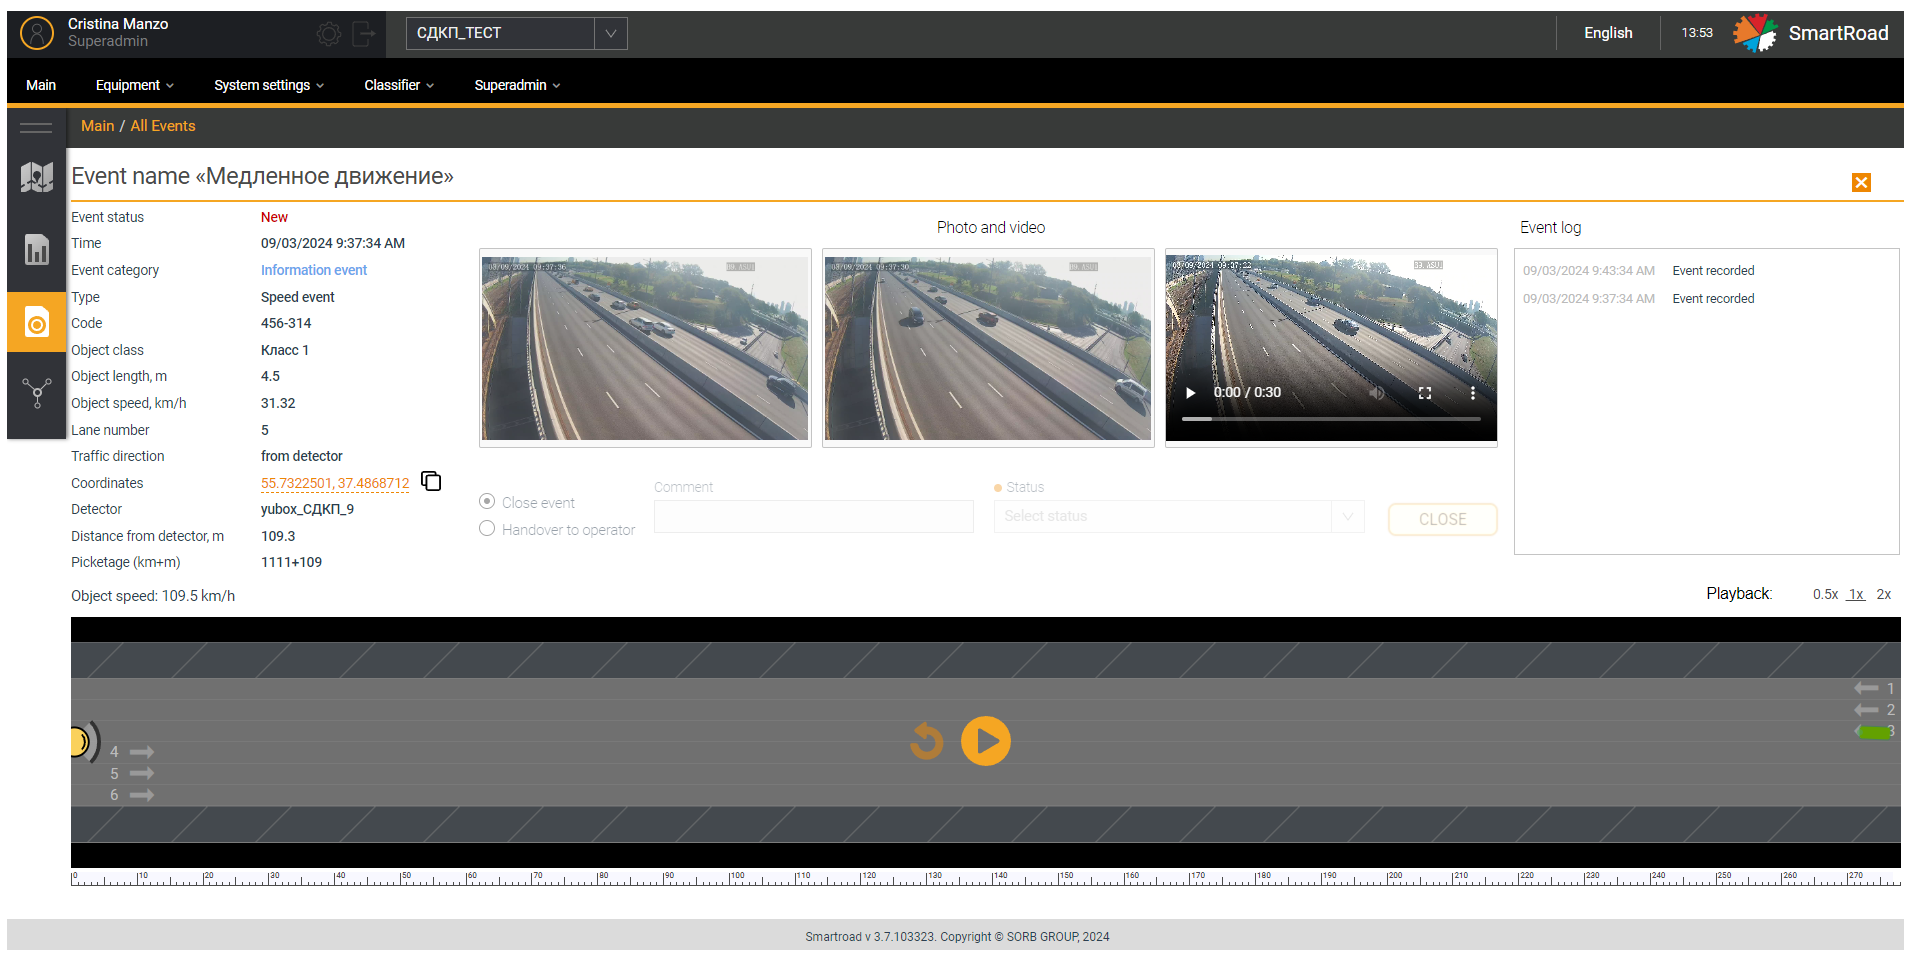
In the table below you can find the Event card parameters
| Parameter | Description |
|---|---|
| Event name | Event name specified in the System |
| Status | Event status |
| Time | Event start date and time |
| Event category | The category of this event is displayed to the user in the field |
| Event type | The field displays to the user the type of this event and the last three characters of the event id |
| The code | Event code, which consists of the event rule code |
| Object class | Object class registered in the System |
| Object length, m | The field displays to the user the length of the object participating in the event in meters. |
| Object speed, km/h | Speed of the object participating in the event |
| Lane number | The field displays to the user the value of the lane number on which the event occurred. |
| Direction of movement | Direction of traffic on this lane |
| Coordinates | Coordinates of the registered event |
| Detector | Name of the detector that recorded the event |
| Distance from detector, m | Distance from the detector that recorded the event |
| Picketage (km+m) | Picketing before the event |
Besides, Photo and video parameter types
| Item type | Description |
|---|---|
| General panoramic photo from the camera | The field displays to the user a general panoramic photo obtained from the camera |
| Close-up photo from camera | In the field, the user is shown an approximate photo obtained from the camera |
| Live camera video | The field displays video from the camera in real time to the user |
The Radio button Close event parameters
| Parameter | Description |
|---|---|
| A comment | A comment for the event is entered in the field. The user must click on the button Close to save a comment in the event card. |
| Status | The field displays to the user a drop-down list of event status: - Confirmed - False alarm - Classification error Pause in work |
| Close | When you click the button, the event is closed |
The Radio button Transfer to operator parameters
| Parameter | Description |
|---|---|
| A comment | A comment for the event is entered in the field. The user must click on Submit button to save a comment in the event card |
| Pass to user | The field displays a drop-down list of operator names to which the event can be passed |
| Hand over | When you press the button, the event is transmitted to another operator |
The Block Processing log parameters
| Parameter | Description |
|---|---|
| date and time | Date and time of log status change |
| Status Log (First Name, Last Name) | List of statuses of all logs for a given event indicating operators |
Finally, the Multiplayer to replay the event parameters
| Parameter | Description |
|---|---|
| Playback 0.5x,1x,2x | The field displays to the user the name of the lane type where the event occurred |
| Play events in the graphical configurator | In multiplayer, the event is played back. |
| Close card | Clicking the button closes the event card window |
Event Rules
Sub-item of the top menu of the System Settings section Event Rules is intended for setting up rules for registering events in the System. On the page Event Rules the user has access to a filter for searching rules and a list of rules created in the System.
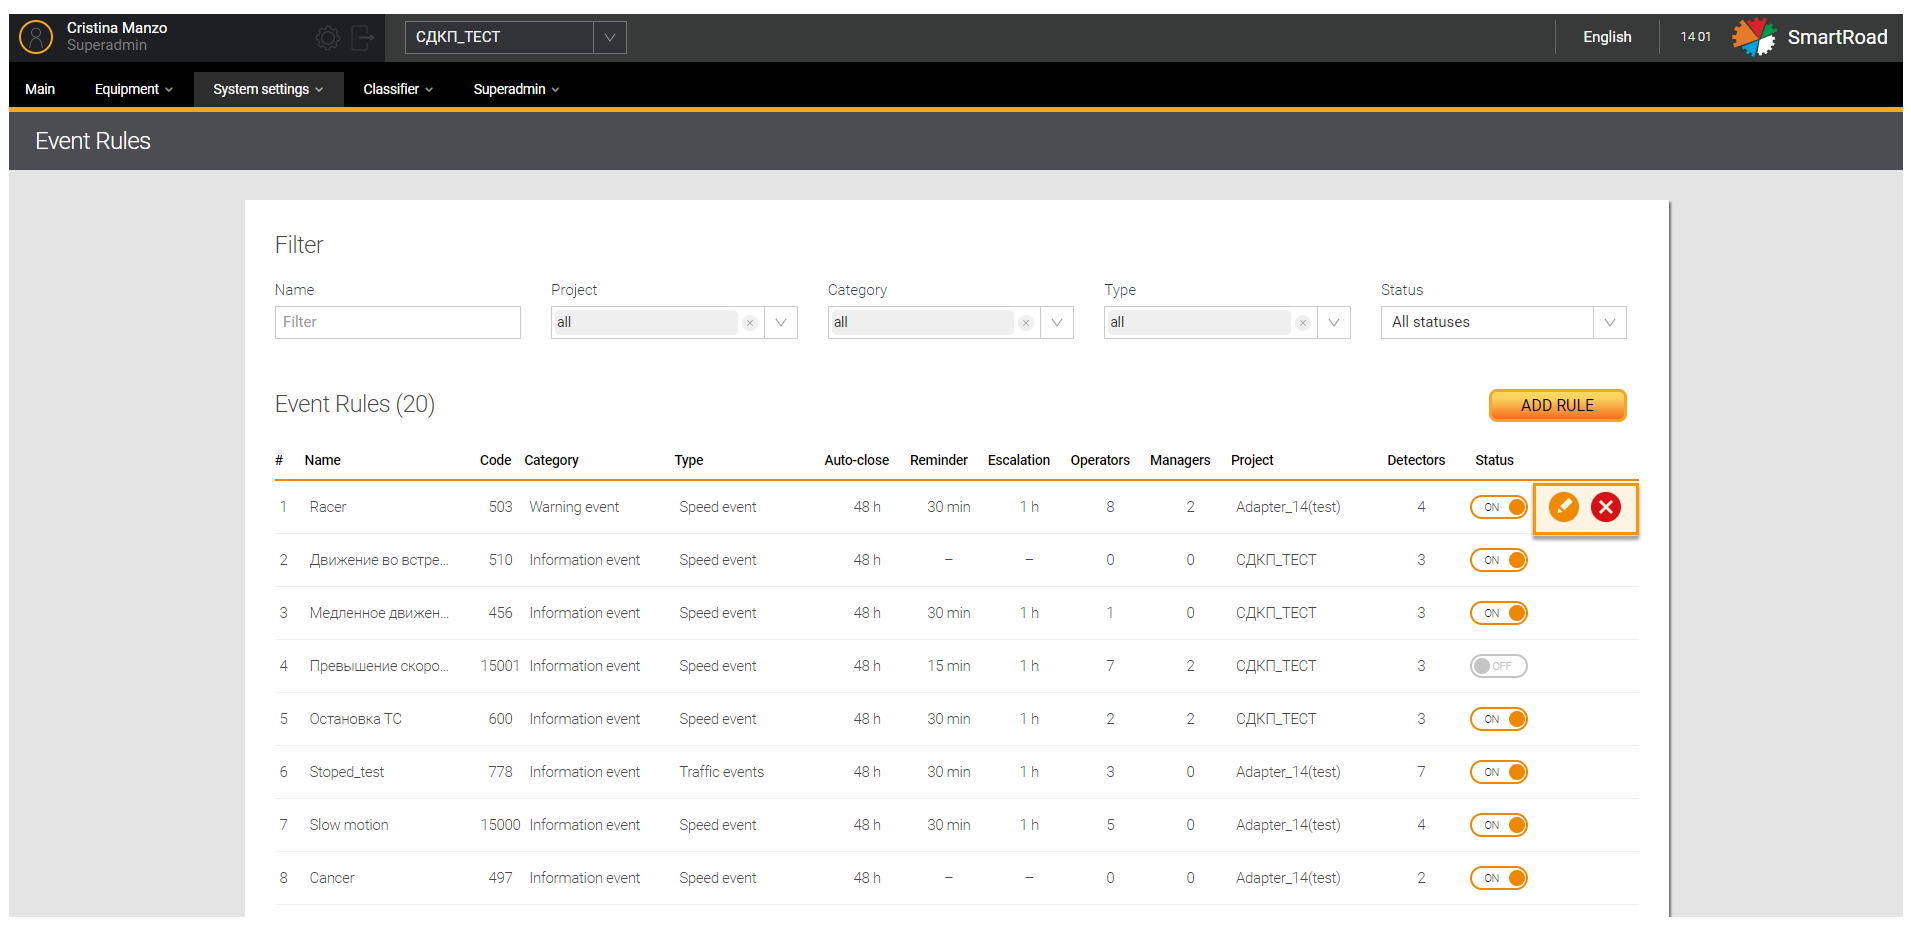
In the table below you can find the Event rule filter parameters
| Parameter | Description |
|---|---|
| Name | The field indicates the name of the event rule specified when registering the rule |
| Project (multiple choice list) | In the drop-down list the projects registered in the System are displayed to the user. The choice is made by checking the checkbox. By default, all list items are selected. |
| Category (multiple choice list) | In the drop-down list, a list of event categories registered in the system is shown to the user: - Information - Warning - Critical event |
| Type (multiple choice list) | In the drop-down list, a list of event types registered in the System is shown to the user: - Speed events - Traffic event - Other events The choice is made by checking the checkbox. By default, all list items are selected. |
| Status | In the drop-down list, a list of event statuses is displayed: - All statuses - Active - Inactive. |
Furthermore, Parameters of the Event Rules list
| Parameter | Description |
|---|---|
| # | The serial number of the entry in the list |
| Name | Event rule name specified when adding the rule |
| The Code | Unique event rule code specified when registering the rule in the System |
| Event category | Event category: - Information - Warning - Critical event |
| Event type | Event types: - Speed events - Traffic events - Other events |
| Auto close | The period of time after which the event will automatically close |
| Reminder | The period of time after which a notification is sent to the operator reminding about the event. |
| Escalation | If an event is not completed (unclosed) by the time of execution, an escalation notification is sent to the project manager after a specified period of time. |
| Operator | A user who has been granted the operator role to work with recorded events |
| Managers | A user who has been granted the manager role to escalate an issue that was not closed within the specified time frame |
| Project | Name of the project in which the rule is applied |
| Detectors | Number of detectors for which it is valid this rule |
| Status | A list of event statuses is displayed. The status is displayed as a switch. When you click the button, the status of the event rule changes to “inactive”. |
Adding an Event Rule
Adding a new rule to the System is done on the page Events by clicking the button Add rule. This will take you to the page Add Rule that enables to create a new rule in the System.
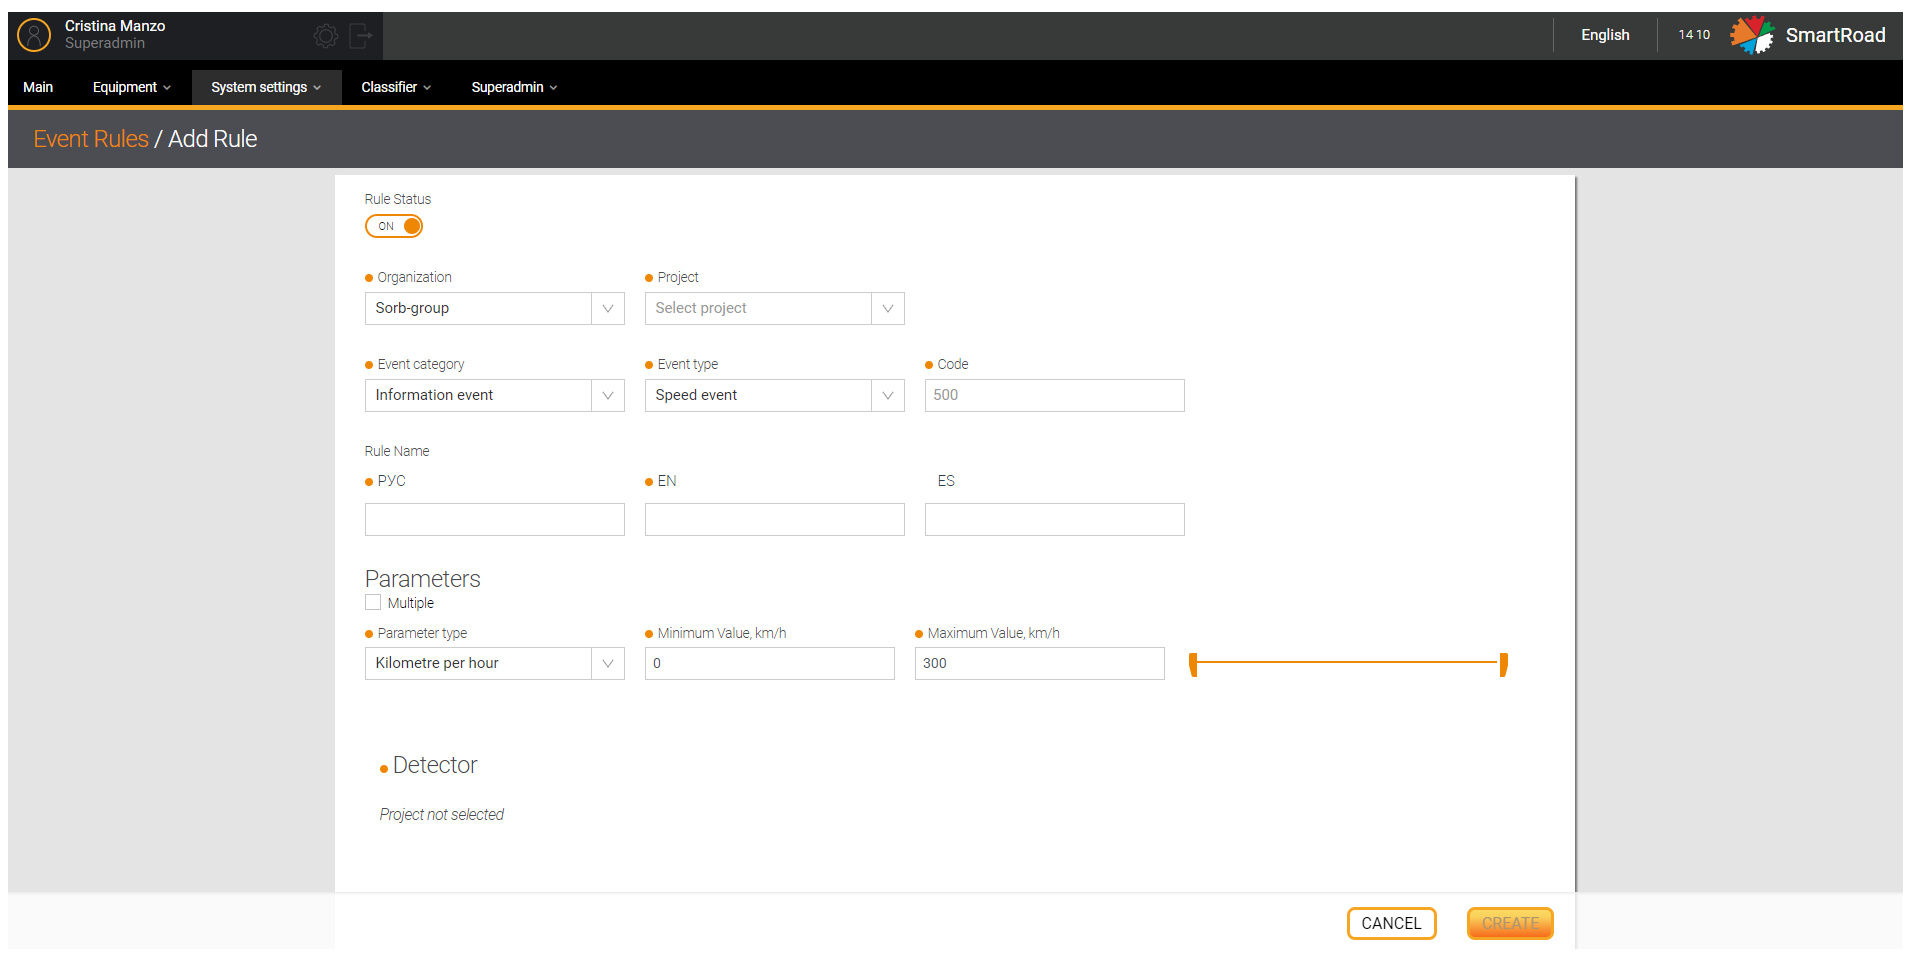
In the next table you can find the Options for adding a rule
| Field / button | Description |
|---|---|
| Rule status | The status is displayed as a button - switch. When you click on the icon, the status of the rule changes to “inactive” and the created rule is not applied in the System |
| Organization*/** | The drop-down list displays a list of organizations available for selection for which the rule will be created. This field is available only for Superadmin (i.e users with role Superadmin) |
| Project* | The drop-down list displays a list of projects available for selection within rule will be applied. This field is available only for Superadmin |
| Event category* | The drop-down list displays a list of selectable event categories for the rule: - Information - Warning - Critical event |
| Event type | The drop-down list displays the list of types available for selection: - Speed events - Traffic events - Other events |
| Code* | A unique rule code, which is independently specified by the user when registering the rule. If you try to create a code with an already registered number, a notification message will appear |
| Name of the rule (RUS)* | The name of the rule in Russian, which will be displayed in the System |
| Name of the rule (EN)* | The name of the rule in English, which will be displayed in the System |
| Rule Name (ES) | Custom rule name in Spanish language that will be displayed in the System |
Furthermore, you will have the following Options
| Item type | Description |
|---|---|
Checkbox Multiple | A checked checkbox indicates that several parameters have been selected for the rule. You can add a maximum of 5 types of parameters. |
| Parameter type | In the drop-down list, select the type of parameter that will be used to determine which parameter or unit of measure for event registration will be used in the rule: - Object in scope Kilometers per hour - - Meters per second - GAP - Headway - Wrong direction - Vehicle stop - Pedestrian detected - Custom Event |
| Minimum value | Minimum unit value (if available). The user can also specify the minimum value using a slider, located to the right of the field. |
| Maximum value | Maximum unit value (if available). The user can also specify the maximum value using the slider that is located to the right of the field. |
Besides, the fields and buttons
| Field / button | Description |
|---|---|
| Slider | It enables to change the minimum and maximum value of a quantity (It is available) |
| Close | Remove parameter type |
| Addition | Add an additional parameter type |
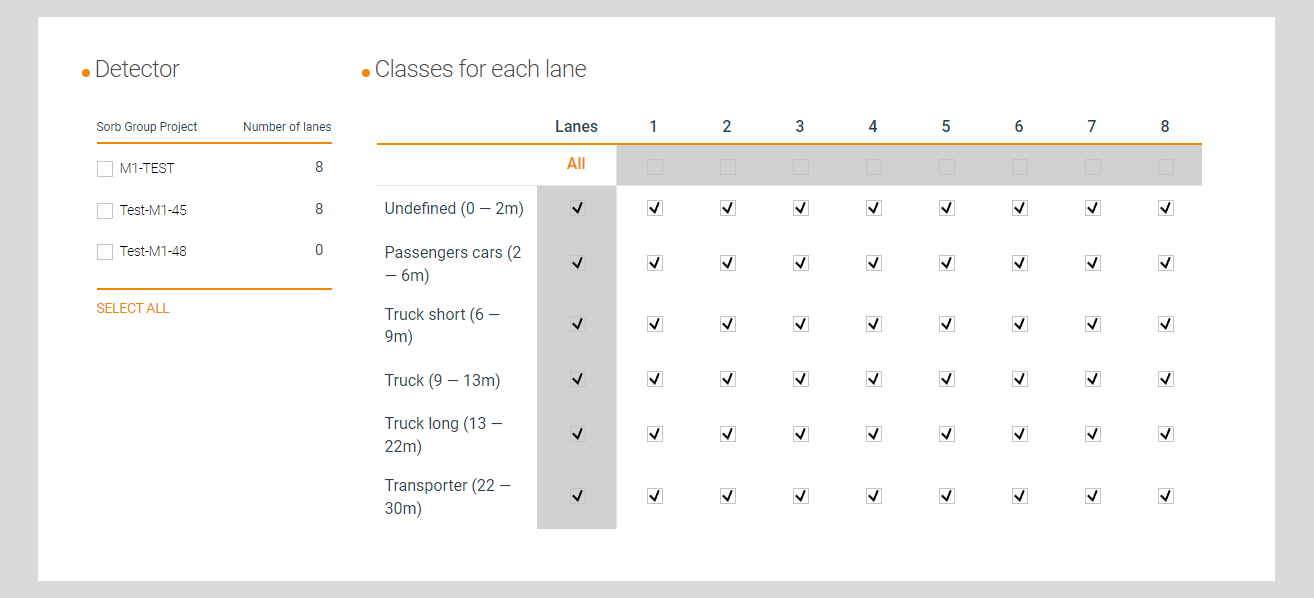
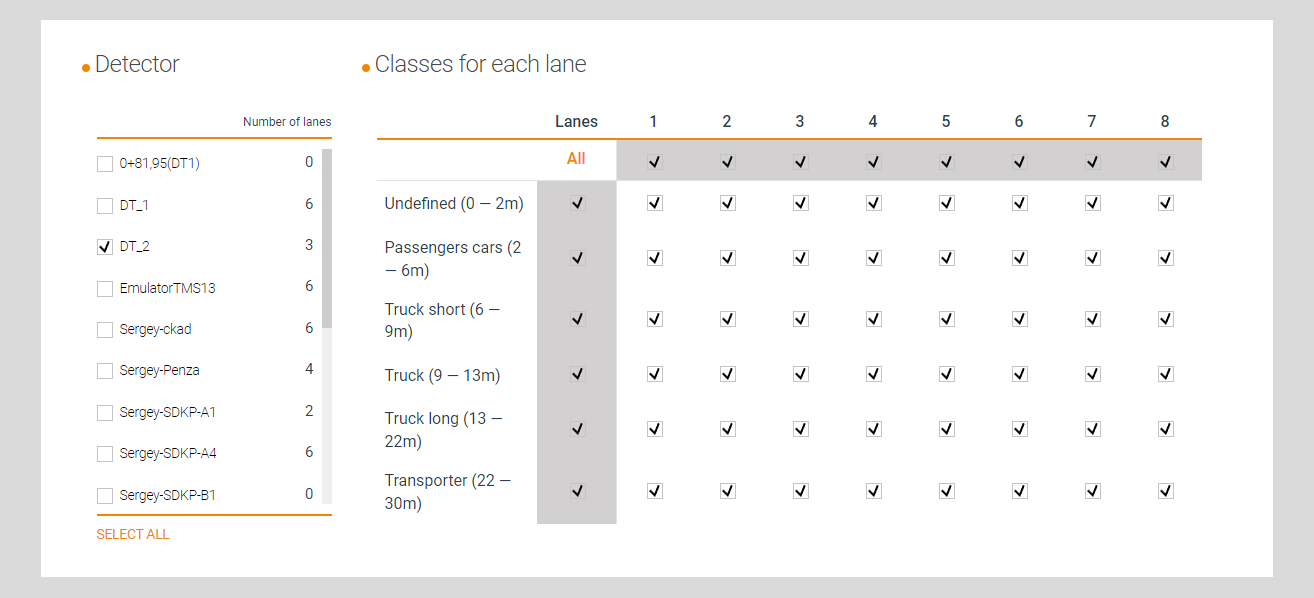
In case of detectors
| Item type | Description |
|---|---|
| Choose all | By checking the checkbox, you can select all detectors in the project to which the rule will be applied. |
| Checkboxes with detector names | The selection of detectors is carried out by installing or removing checkboxes. The checked checkbox is a sign of application of the rule for the detector |
Finally, the Classes for each band
| Item type | Description |
|---|---|
| Stripes | Select a band or all bands using the All button |
| Classes | According to the classes registered in this project, by default: - Undefined (undefined) – 0-2 m - Passenger cars (passenger cars) – 2-6 m - Truck short (short trucks) – 6-9 m - Truck (trucks) – 9-13 m - Truck long (long trucks) – 13-22m - Transporter (transport road trains) – 22-30 m |
| Save | A button that, when pressed, the system saves entered parameters and and creates a new rule |
| Cancel | A button that, when clicked, resets all entered parameters and cancels the creation of a new rule |
(*) - It is a mandatory field
Fields whose values are entered incorrectly will be highlighted in red. The values in them need to be changed.
Setting up roles in the decision module
You should click on Add new rule and then in the list of rules press the edit button to configure or change roles in the event module.
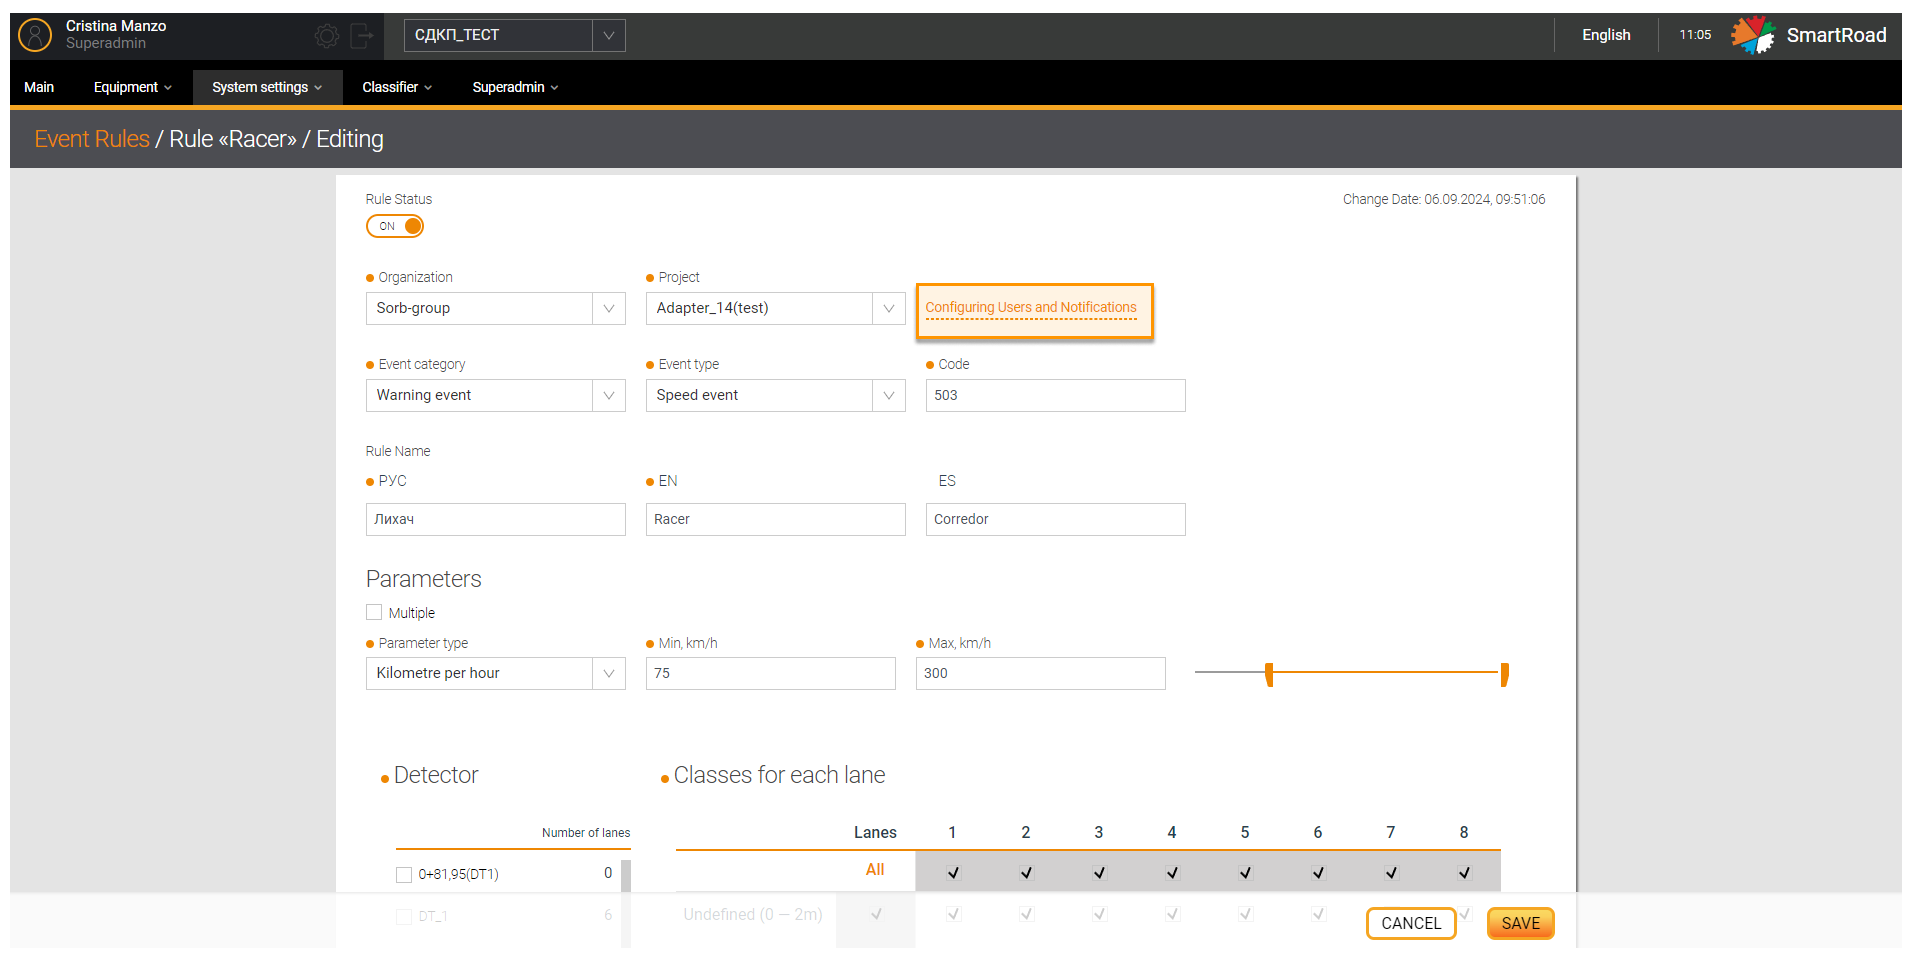
In the Rules editing window that opens, click on the button Setting up users and notifications. Afterward a pop-up window will appear with additional rule settings.
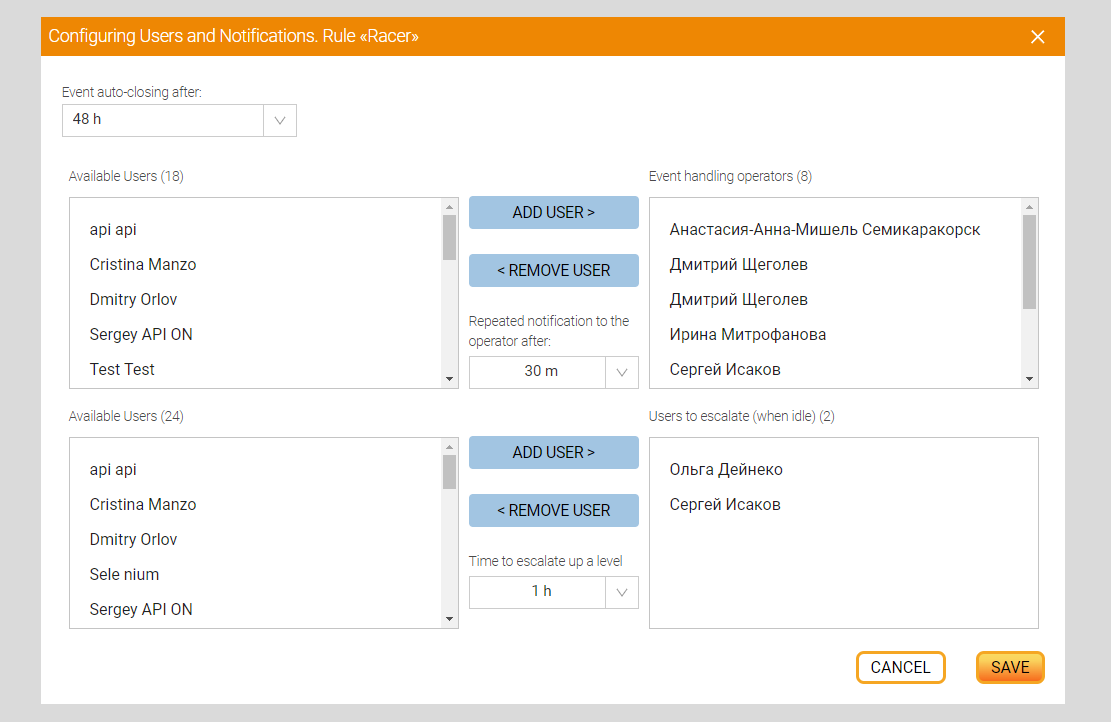
In the table below the options for Configuring users and Notifications are described.
| Field / button | Description |
|---|---|
| Auto-close via event | In the drop-down list, you can configure the time period for notifying about the closure of an event. |
| Available users | A field for selecting users already registered in the System by the superadmin to add them to the project for further work with it. Adding users to the project can be done by selecting the required user and clicking the button Add |
| Event Operators/Supervisors | The field displays the users (operators/managers) added to the rule |
| Add | Add an operator or manager to a rule |
| Put away | Removing users from a rule is done by selecting Event Processing Operators/Managers in the window and clicking the Remove button |
| Repeated notification (through operator) | In the drop-down list you can configure the period for re-notifying the operator |
| Notifying (through manager) | In the drop-down list you can configure the manager’s notification period |
| Cancel | Cancel changes made |
| Save | Save changes |
Delete and edit an event rule
You should hover the mouse cursor over the entry in the list and click on the edit button to change the rule parameters. When you click the button, the event rule editing page will open (similar to the rule adding window) with the previously specified parameters.
In case of removing a rule from the system, you must click on the delete button. When you click on this button, you must confirm the deletion in a pop-up window by clicking Delete or cancel deletion by pressing the button Cancel.
Selecting detectors on the map
You can select detectors by left-clicking on a detector marker on the map. In this case, the detector marker changes to a similar icon with a white circle in the center.
When selecting a detector and going to a detailed report in the field Selecting a detector for a report the name of the selected detector will already be added. When selecting multiple detectors and going to a consolidated report, in the report field Selecting detectors for the report the selected detectors will already be added.
Viewing detector information on the map
The interactive map displays groups of detectors in the form of a table with the names of all detectors located at a given point on the map and their operating statuses. When the scale of the interactive map is reduced, detectors located close to each other are combined into a group. The group will be depicted on the map as a pie chart, showing the number of detectors within the circle. When you hover the cursor over a group of combined detectors, a pop-up list should appear containing a list of detectors, as well as their status in the form of corresponding icons. The operating statuses of the combined detectors are displayed in the different colors by the border of the pie chart. When you hover your cursor and click on one of the combined sensors, a pop-up list appears. Besides if you hover over an item, brief information about the selected detector will appear. Clicking on it will open the detector settings page.
You must select the detector name in the list and hover your mouse over it to view the information related to the selected detector. The number of detectors in this group is displayed inside the detector group marker.
When zooming into a detector in detail on the interactive map, you must hover your mouse over the detector marker to view information about the detector. This will display a pop-up window with information about the detector.
| Parameter | Description |
|---|---|
| Detector name | The name of the detector assigned to it in the System |
| Detector ID | Unique detector identifier |
| Detector IP address sds | Unique address identifying the detector |
| Date | Detector creation date |
From 0 km / to 0 km 🏍️
| Parameter | Description |
|---|---|
| Traffic intensity | The number of vehicles passing through the cross-section of a highway per unit of time (per day or one hour). |
| Average driving speed | The arithmetic mean of the speeds of vehicles traveling in one direction along a section of road |
| Traffic density | Number of vehicles per 1 km of road |
Event Rules
Section Event Rules at the Top menu is intended for setting up rules and registering events in the System.
When you click on the Event Rules tab, you go to the Event Rules page, which contains a filter and a list of available event rules.
Detailed information related to Event Rules functionality can be found in Decision-making module.